Weekly Market Outlook – Everything Just Changed, Yet…

Wow. That was… intense. We knew the market was already under fire headed into last week, having fallen a total of 2.5% over the course of the prior two weeks. The S&P 500 took a hefty 3.0% tumble last week alone though, snapping several important technical support levels in the process. The best thing going for the bulls now is the sheer scope and speed of the selling, which sets the stage for a snapback bounce.
We’ll take a detailed look at the action and what’s likely to take shape from here. First, however, let’s run through last week’s biggest economic announcements and preview what’s in the lineup for this week.
Economic Data Analysis
Busy week.
It started in earnest on Monday, with last month’s retail sales data. It was good, and markedly better than expected. Higher prices might explain some of this increase, but more notably, higher prices didn’t deter consumers from spending altogether. Some stratifications of the data reached record levels, although when taking food and gas out of the calculation, spending growth was just OK.
Retail Sales Charts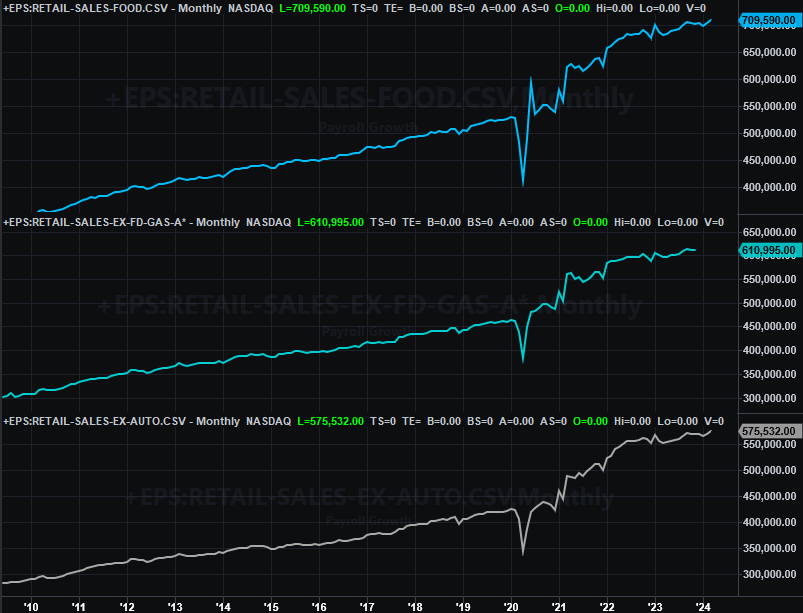
Source: Census Bureau, TradeStation
Still, overall retail spending is constructive for the economy.
While retail consumption remains reasonably healthy, interest in homebuying seems to be weakening just a bit. Housing starts and building permits both fell in March, and by more than just a little.
Housing Starts and Building Permits Charts
Source: Census Bureau, TradeStation
For a while it was looking like this sliver of the real estate market was on the mend. Now that’s looking less likely. Blame re-rising interest rates, mostly.
Industrial production and the utilization of the nation’s industrial capacity both saw measurable improvements last month, but not wildly so. These measures still mostly look like they’re on the defensive. That’s it. Not terrible, but certainly not good.
Capacity Utilization and Industrial Productivity Charts
Source: Federal Reserve, TradeStation
Everything is on the grid.
Economic Calendar
Source: Briefing.com
This week’s going to be similarly busy. On Tuesday we’ll hear March’s new home sales figure. Economists are forecasting a slight improvement on February’s annualized pace of 670,000. In this vein, note that we heard about March’s sales of existing homes last week, and they fell a pretty good amount. We’ll likely see the same on the new-home sales front, particularly in light of the fact that starts and permits also tumbled last month. The interest just isn’t there.
New and Existing Home Sales Charts
Source: National Association of Realtors, Census Bureau, TradeStation
On Friday we’ll hear last month’s personal income and personal spending numbers. While less followed than raw inflation data, this is actually the data the Fed first and foremost considers when making decisions regarding interest rates. And that’s a problem. Both spending and incomes have been growing quite a bit, and in step with one another. That didn’t likely change in March. The Fed remains rather limited in its ability and freedom to cut interest rates.
Finally, on Friday we’ll get the third and final reading of the University of Michigan’s sentiment index for March. It should be down just a bit from February’s reading, although that’s still relatively high.
Consumer Sentiment Charts
Source: University of Michigan, Conference Board, TradeStation
The Conference Board’s consumer confidence report for the current month will be released next week. This data hasn’t jibed with the University of Michigan’s. It’s anemic, at best.
Stock Market Index Analysis
The bears ran the table last week, dragging the market down every single day. When all was said and down, the S&P 500 lost 3.0%, while the NASDAQ Composite fell 5.5%. In both cases these moves pulled the index in question below technical support levels.
For the S&P 500, that’s primarily the 50-day moving average line (purple) at 5,118. You may recall this line was propping the index up a week earlier. That floor failed on Monday of last week though. Once the floodgates were open, the bears never looked back. You’ll also see on the daily chart below the S&P 500 Volatility Index (VIX) has finally started punching through its recent technical ceilings between 17 and 19.
S&P 500 Daily Chart, with VIX and Volume
Source: TradeNavigator
Here’s the weekly chart of the S&P 500… for a little more perspective. From this vantage point you can see how big last week’s selloff was. You can also see how vulnerable the index was to such a pullback following its unfettered rally from October’s low. Perhaps most noteworthy on the weekly chart, though, is that we now have a bearish MACD divergence… a MACD crossunder suggesting a new downtrend is underway.
S&P 500 Weekly Chart, with VIX and Volume
Source: TradeNavigator
Here’s the daily NASDAQ Composite chart. It broke under its 50-day line (purple) on Monday as well, but it didn’t stop there. The sellers continued to pile on until they pulled the composite below its 100-day moving average line (gray) at 15,489, ending a 5.4% tumble for the whole week. Also notice that like the VIX, the NASDAQ’s Volatility Index (VXN) punched through its technical ceiling at 20 for the first time since October.
NASDAQ Composite Daily Chart, with VXN and Volume
Source: TradeNavigator
Here’s the weekly chart of the NASDAQ Composite, just to help you get a better handle on how this is all going down… literally and figuratively.
NASDAQ Composite Weekly Chart, with VXN and Volume
Source: TradeNavigator
It’s difficult to interpret all of this as anything but bearish. That being said, perhaps the best thing going for the bulls right now is the sheer scope of the selloff itself. It’s all happened so fast that the pump may be primed for a robust bounceback.
Just don’t be too quick to jump on board any bounce. The market’s suffered some serious technical damage in just the past three weeks. Any bounce may merely be reflexive, and short-lived. Both of the indices will need to fight their way back above their 20-day and 50-day moving average lines to truly rekindle bullishness. That’s not a realistic expectation just yet though. This weakness hasn’t likely run its full course yet. We’ll look at prospective landing points for this pullback when it becomes more relevant. That may be as soon as next week.