Weekly Market Outlook – A Less-Than-Ideal Bullish Follow-Through
Another week, another win. The market logged a third consecutive weekly gain last week, with the most recent one accelerating from the prior one’s slower pace. Thanks to last week’s 2.2% advance, the S&P 500 is now 9.7% above its late October low. That’s a lot of ground to cover in that short amount of time.
The scope of this move of course snaps the market out of its swoon from August’s peak to last month’s low. It also sets the stage for some profit-taking. The question is, will any profit-taking push the market back into a more sustained selloff? Given the time of year and market’s technical circumstances, probably not. It wouldn’t be unwise to wait and see how well stocks hold up against any real selling pressure though.
We’ll look at the matter in some detail in a moment. Let’s first look through last week’s biggest economic news. On balance, it wasn’t great. Stocks soared anyway specifically because of that weakness.
Economic Data Analysis
You read that right. Last week’s so-so economic reports were actually bullish in the sense that they give the Federal Reserve more room and reason to stop ratcheting interest rates higher.
Chief among these numbers is October’s inflation data. It continued to dwindle, with or without food and gas prices and for producers as much as for consumers. Although still not back to the Fed’s target levels, things are certainly moving in that direction.
Annualized Inflation Rate Charts
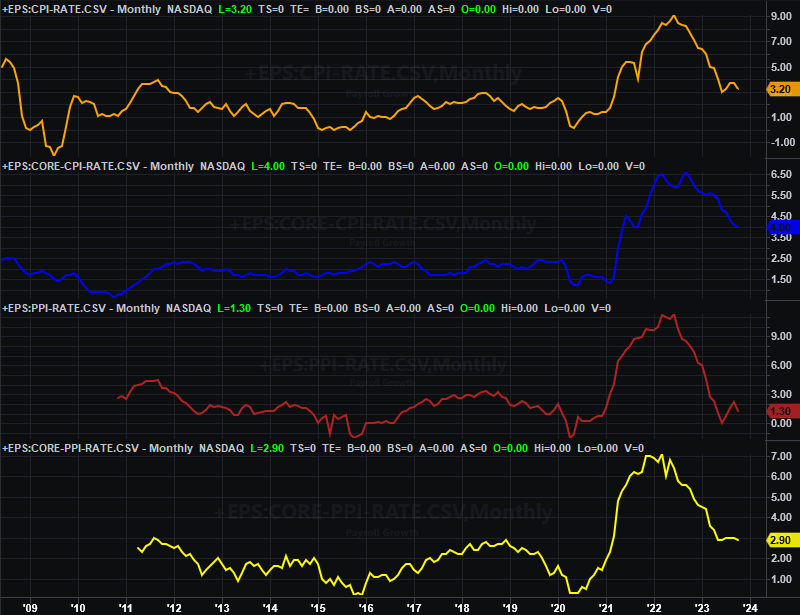
Source: Bureau of Labor Statistics, TradeStation
Retail sales leveled off last month too. It’s too soon to call it a decline though. So, this is net-good in the sense consumers’ pricing power -- and interest in discretionary spending -- is peeling back.
Retail Sales Charts
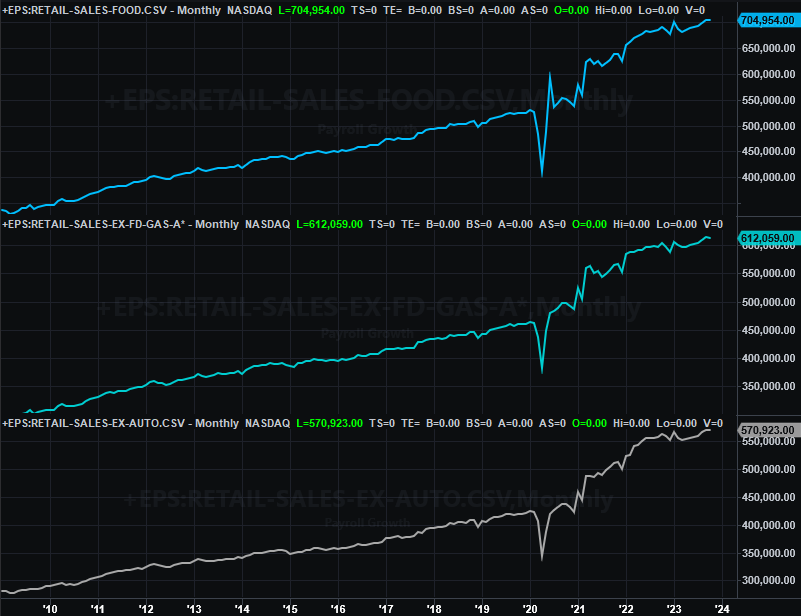
Source: Census Bureau, TradeStation
Last month’s industrial production fell a bit, although utilization of the nation’s production capacity actually ticked a bit higher. Neither figure, though, rolled in dramatically different from September’s. Still, you get the sense that both of these data sets are slowly easing into downtrends. And that’s a problem. The correlation between these numbers and corporate earnings and the market’s long-term trend is actually pretty tight.
Capacity Utilization and Industrial Productivity Charts
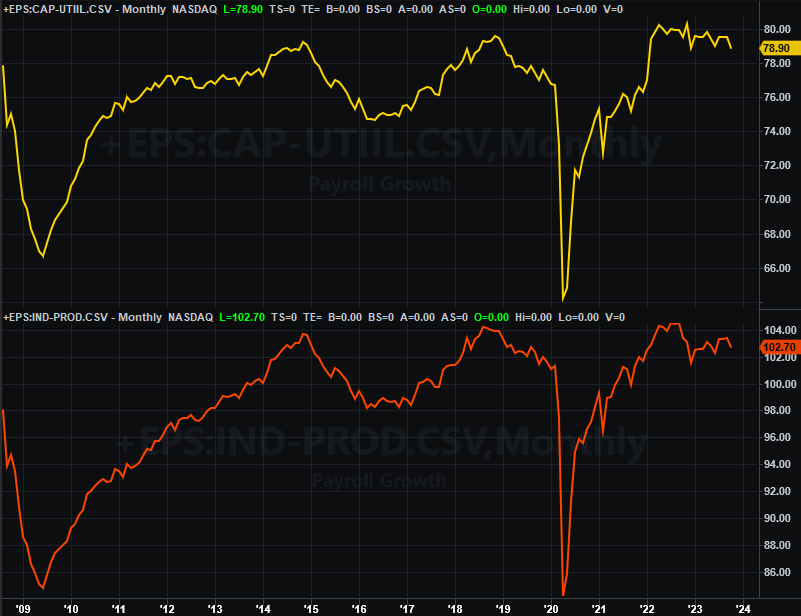
Source: Federal Reserve, TradeStation
Finally, on Friday we heard last month’s housing starts and building permits. They were more or less in line with September’s levels too, although up slightly. Still, both starts and permits remain near relatively low levels.
Housing Starts and Building Permits Charts
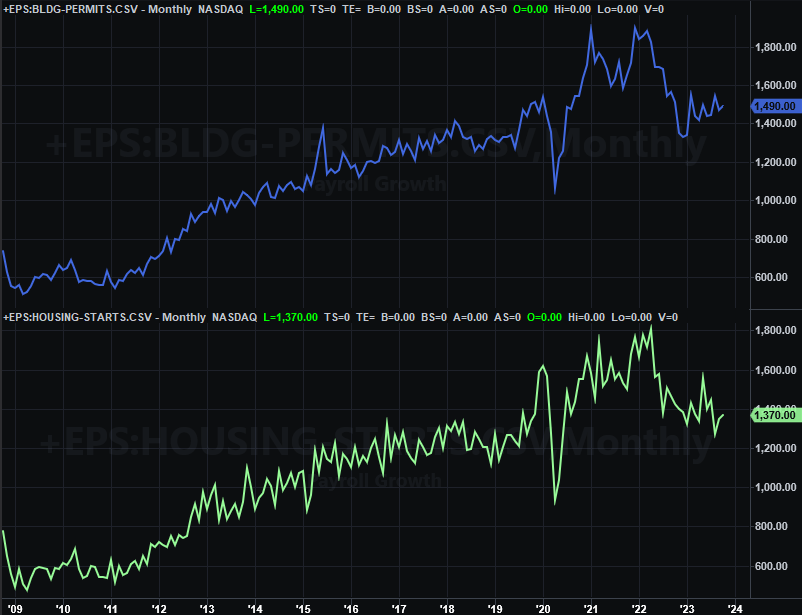
Source: Census Bureau, TradeStation
Everything else is on the grid.
Economic Calendar
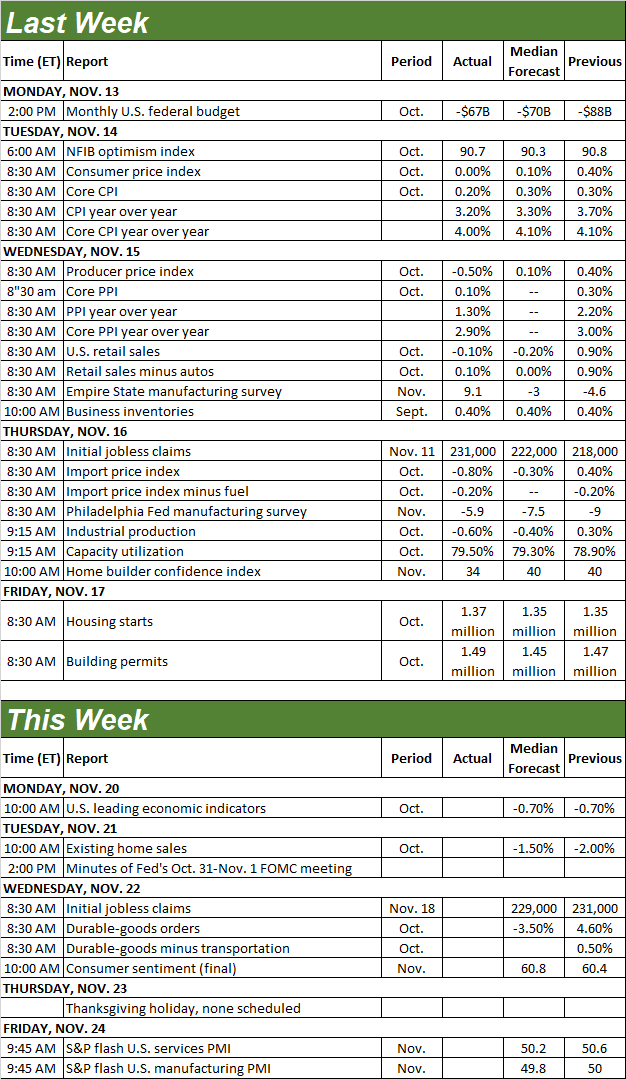
Source: Briefing.com
This week’s economic data is limited by the Thanksgiving holiday on Thursday, although we will be able to squeeze a couple of reports in. On Tuesday, for instance, we’ll hear about last month’s sales of existing homes. They’re likely to have fallen again. But…
Home Sales Charts
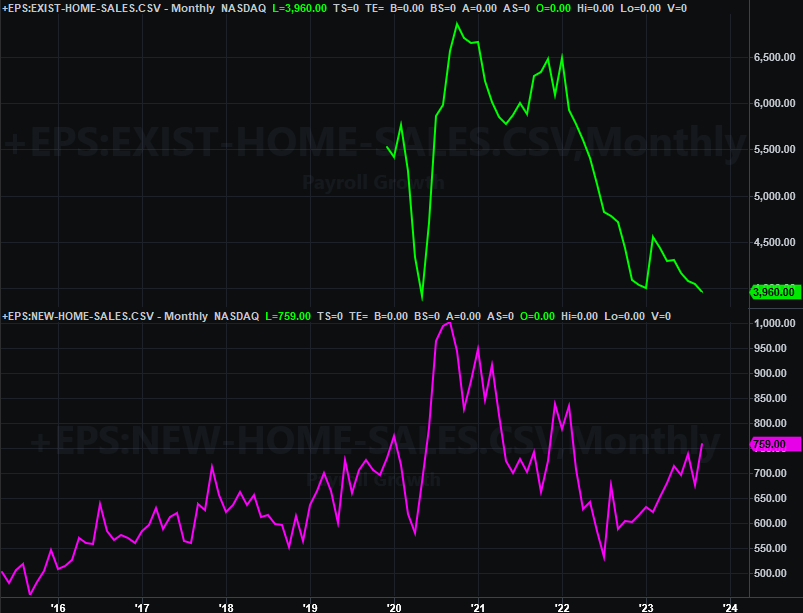
Source: National Association of Realtors, Census Bureau, TradeStation
October’s new home sales won’t be released until Monday of the coming week, but notice that sales of newly-built houses continue to rise. This mostly reflects a lack of inventory of existing homes for sale. Would-be buyers are being forced to purchase new homes.
On Wednesday of this week look for the third and final reading of November’s University of Michigan sentiment index. Economists believe it fell yet again. One poor month isn’t fatal for the market. If investors continue to sour on what the future holds, however, it will eventually be reflected in stock prices.
Consumer Sentiment Charts
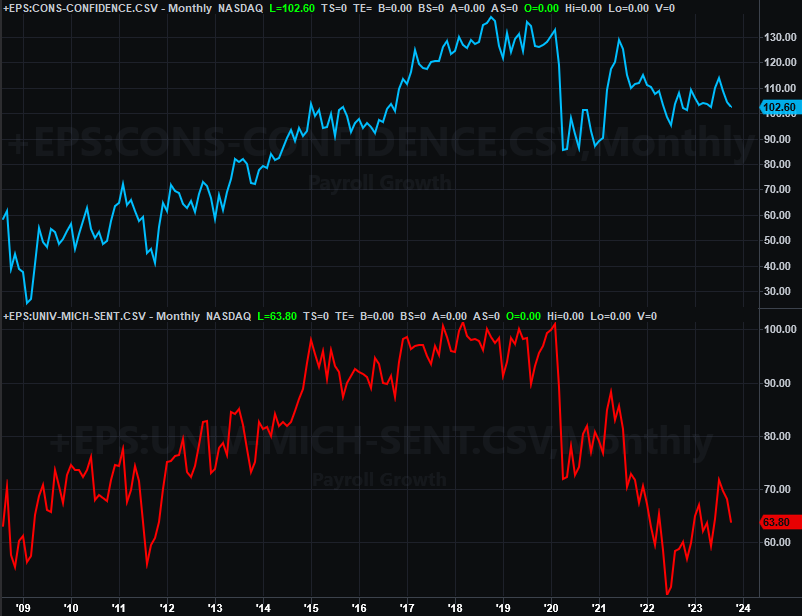
Source: Conference Board, University of Michigan, TradeStation
The Conference Board’s measure of consumer confidence will be reported on Tuesday of the coming week. Note that it’s deteriorating as well. Another tumble could confirm (or reject) what the University of Michigan’s sentiment reading tells us.
Stock Market Index Analysis
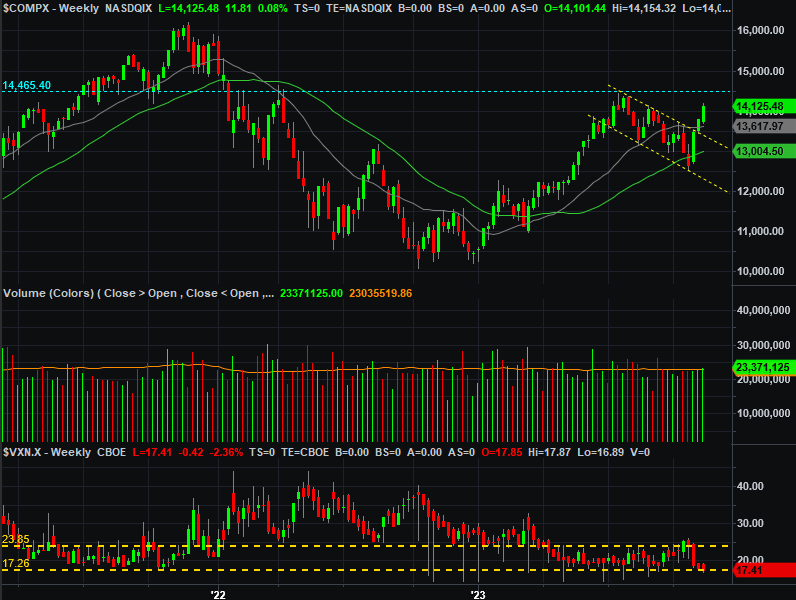
We start this week’s analysis with a look at the weekly chart of the NASDAQ Composite. It’s this vantage point that puts the past three weeks’ bullishness into their proper perspective. Note that the composite is now well above the last of the resistance lines that were actually hurdled two weeks ago. This is bullish.
NASDAQ Composite Weekly Chart, with VXN and Volume
Source: TradeNavigator
That’s clearly a huge three-week runup. But, that doesn’t guarantee it’s over. The composite’s mustered bigger and longer-lived rallies in the recent past. The next major technical ceiling lies above at 14,465, where the NASDAQ peaked in August as well as in April of last year. The index could conceivably continue marching higher until that resistance is met.
On the other hand…
The NASDAQ’s Volatility Index (VXN) is back to absolute low levels that are often met when the market is at or near a peak. The composite could continue inching higher while the VXN simply moves sideways. That’s not the ideal backdrop for a sustained rally though.
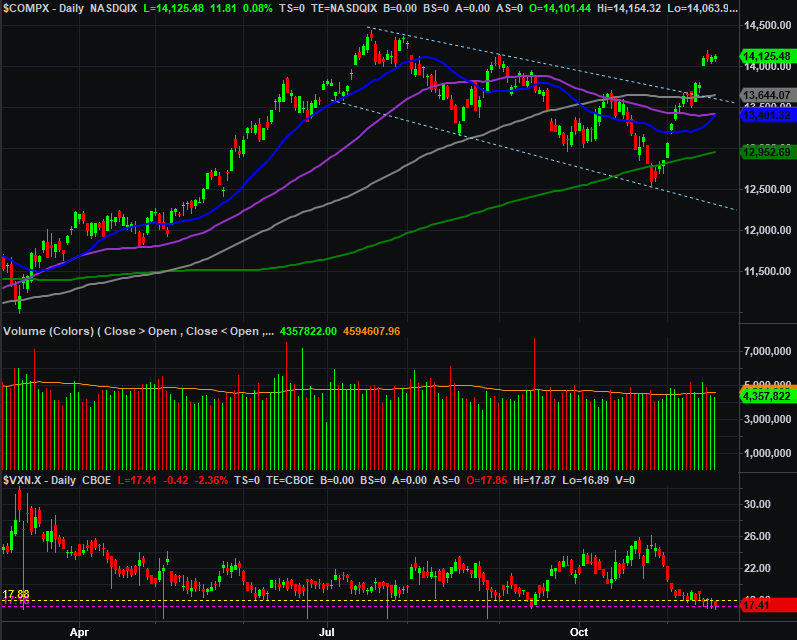
Here’s the daily chart of the NASDAQ Composite, which shows us another potential problem for the rally. That’s the big gap between Monday’s close and Tuesday’s open. Not only is that gap now drawing the index back to fill it in, once it had been made, the buying mostly stopped. The daily chart also shows us that there was never any strong volume behind any of the buying… not even Tuesday’s big gain.
NASDAQ Composite Daily Chart, with VXN and Volume
Source: TradeNavigator
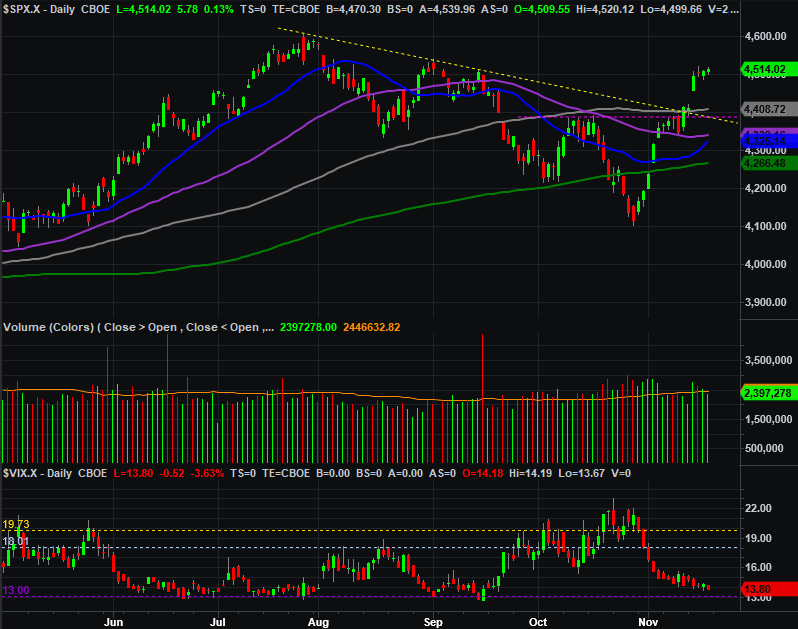
Here’s the daily chart of the S&P 500. Same story. That is, the index was already just a hair above some important technical resistance lines to start the week. Thanks to Tuesday’s surge, those lines are new deeper in the rearview mirror.
S&P 500 Daily Chart, with VIX and Volume
Source: TradeNavigator
The daily chart of the S&P 500 also shows us the same potential problems the NASDAQ Composite faces though. Those are, Tuesday’s gap works against the market (even if only for psychological reasons), and the S&P 500’s volatility index (VIX) is near “too low” of a level to give stocks the room and reason they need to run right now. Also, again, notice there wasn’t a whole lot of volume behind last week’s gain. This may or may not be a majority opinion. We’ll have to wait and see how things shake out when the market is truly tested.
Problem? We’re headed into a week that’s usually bullish, but only mildly so. We might have to wait a week to know what traders are truly thinking. That might work out for the best though. Stocks could ease back to former technical ceilings -- now floors -- without anybody really noticing or caring. That will let both of the indexes start next week pushing up and off of well-established support.
If we don’t happen to get that gentle pullback, stocks can still rally as we move into December. That opens the door to a decent-sized correction in the first full week of December. Again though, that might be an ideal setup for the usual year-end strength.
Whatever’s in the cards, have a happy Thanksgiving.