On President's Day... Where Is Biden's Market vs. Where it Should Be?
-- Stocks are right around where they should be at this point of Joe Biden's presidency. --
With the market closed on Monday in observance of President's Day, we've got some time to look at things we often don't have a chance to look at. In this case, it's a review of how the stock market performs during the typical four-year Presidential term.
The tendencies are strangely reliable. The market's often wobbly right around the time a new President takes office (or re-takes office, for second-term Presidents), then rallies for a few months. By the latter half of the average President's first year, however, the stock market is spinning its wheels, and will continue to do so through the mid-term elections almost two years after taking office. The third year is usually a good one, as is the fourth year.
The market under Biden's been a little bit different than usual. Stocks were soaring shortly after he took the helm, and remained how all the way through the end of 2021. Then in 2022 disaster struck. Indeed, it was a rather nasty bear market. It looks like we're starting to recover now, but that rebound effort still feels a bit hit-and-miss.
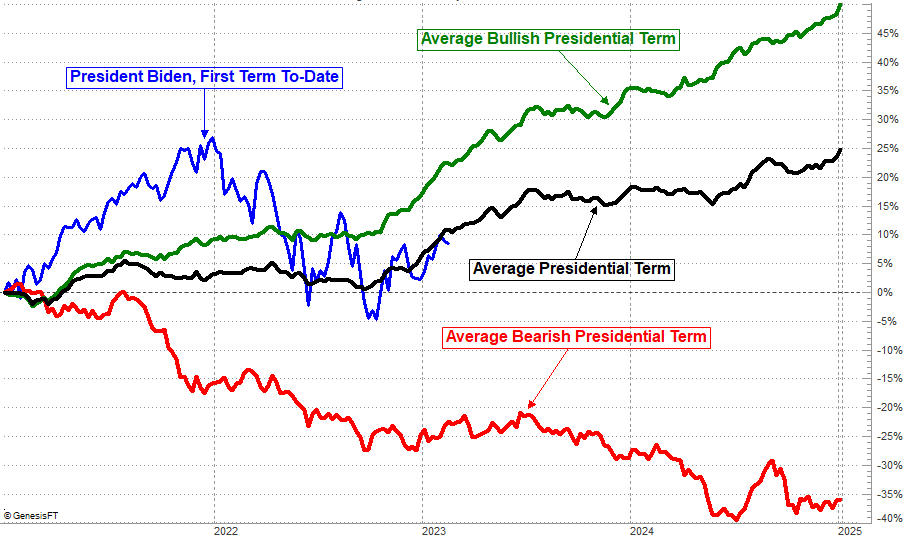
The thing is, thanks to the rebound since October's low, the S&P 500 is back on track with where it should be at this point in time. That is, up just a little from where the index was when the President took office. The image below tells the tale.
Be careful about using the "average" Presidential term as a benchmark, since we rarely see the average. In most cases we typically see a performance above the average, and on occasion we see a below-average performance... a prolonged bear market that keeps chipping away during the four-year stretch in question. The graphic below shows each four-year return for the S&P 500 going all the way back to the early 1900's (see the thin, faint green lines). Four-year bear markets coinciding with a Presidential term are actually rather rare.
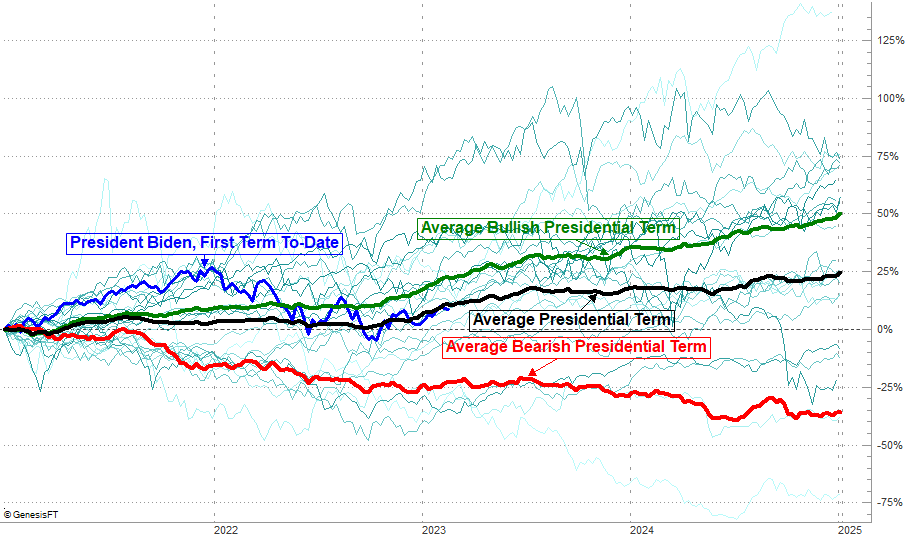
All the same, both charts point to one surprisingly clear idea. That is, there really is a tendency for bullishness in the third and fourth years of a Presidential term... even when the four-year span is net-bearish. In the same sense, there really is a tendency for a good, bullish start to a President's term that tends to peter out in the second year. The S&P 500's rise then fall in 2021 and 2022 really isn't all that unusual. If anything it raises the odds that we'll see the usual third-year bullishness that bleeds into fourth-year bullishness.
That's not a guarantee, of course. The stock market is still subject to a bunch of other factors that have little to nothing to do with political office terms. Remain ready for anything and everything.
If you're playing the odds or looking for some sort of framework though, know that things are right around where they should be at this time, steering into what should be a pretty good year.