Don't Read Too Much Into Q1's 18% Plunge in Demand for Gold
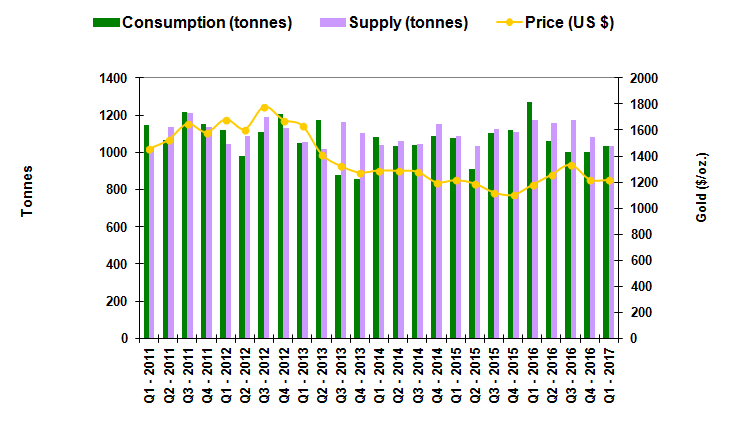
On Thursday morning, the World Gold Council published some Q1 numbers that -- of taken out of context -- could be downright alarming for gold bugs. That is, last quarter's total demand for gold fell 18% on a year-over-year basis. What most of the news coverage of the WGC's preliminary report didn't bother mentioning was, the Q1-2016 demand for gold was oddly strong... a record high, actually. It shouldn't be used as a yardstick. In fact, if anything, fans of gold should be excited about the fact that for the first time in four quarters, the supply of gold didn't decidedly exceed actual consumption of the metal.
The raw numbers: Last quarter, the world used 1036 tons... slightly more than the 1032 tons that miners and recyclers produced. It was the closest supply/demand balance seen since the fourth quarter of 2015. The graphic below also makes it clear that a comparison to data from the first quarter of 2015. Demand spiked that quarter, to record levels. Suppliers ramped up their capacity in response to that surge in demand, though they overshot - demand was never going to last at those levels. Since then, output has waned, and demand has caught up.
A closer look at where the demand came from then (and is still coming from now) would have shed some light on what to expect.
In the first quarter of 2016, a whopping 342 tons of gold was garnered to make new gold-bases shares of ETFs. It was an impressive surge to be sure, especially considering the net-selling of gold in ETF pools that had been seen over the course of the prior three years. To say it was a suspicious surge, however, would be an understatement. Gold ETFs are generally the preferred method of playing gold by amateurs, who tend to get in and out of trends at the worst possible time the sudden bullish interest then should have been a warning that gold was at a major peak. The rally lasted a couple more quarters, albeit tepidly, and then petered out in the middle of last year.
A closer look at all the other uses of gold in the first quarter of 2016 would have indicated that the more reliable uses of the metal were still shrinking. Central banks, jewelers, technology makers, and even the companies that turn gold into bars and coins has been winding down their consumption of the metal.
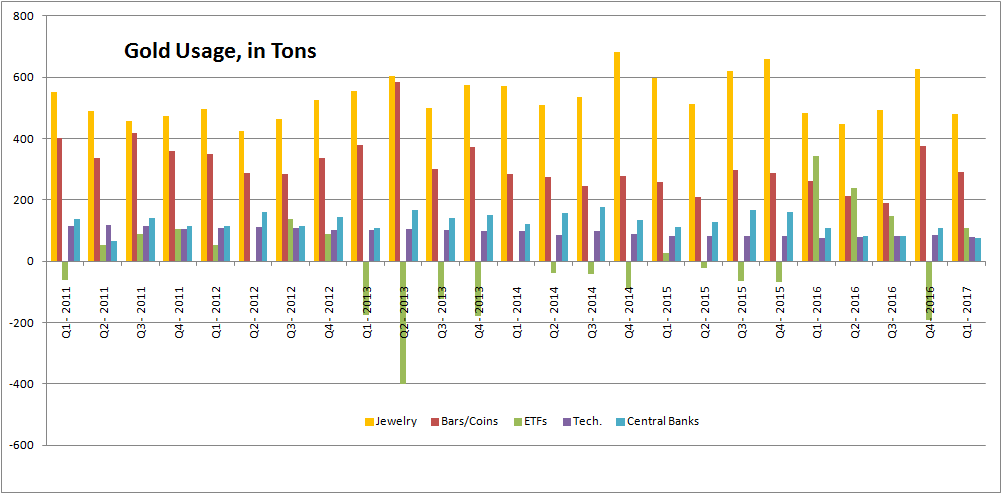
The irony? Although total gold demand fell 18% year-over-year during the first quarter, the ETF industry's waning demand is responsible for about 17% of that 18% lull. Banks, jewelers, bars and coins and technology companies uses about as much as -- if not more -- gold in Q1-2017 as they did in Q1-2016.
Unfortunately, although fans and followers of gold should arguably ignore the impact that ETFs have on gold's demand, they can't. Although gold usage is actually on the rise now, gold prices are falling.
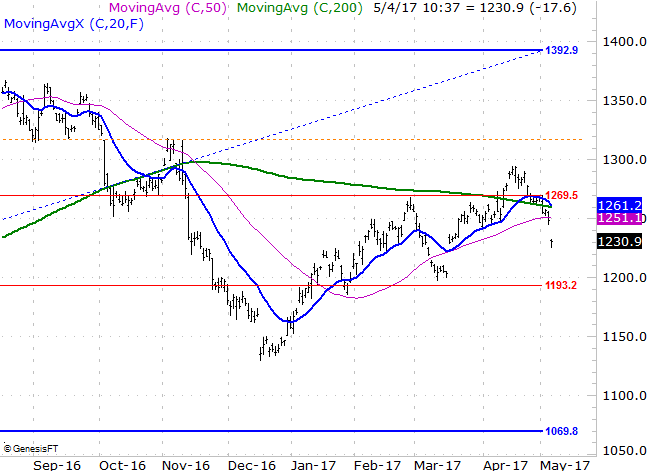
That's got more to do with the chatter after the Federal Reserve's comments yesterday, its failure to raise rates, and the U.S. dollar (plus all the speculation surrounding those matters), but a sentiment-driven downtrend is a downtrend all the same. Gold futures had already broken under a key support area around $1260 per ounce, but went from bad to worse this week, failing to make good on the bullish breakout that started to materialize in the middle of last month.
The short-term/daily chart of gold doesn't paint an encouraging picture. It's trapped between $1193 and $1269, and there's a huge hurdle around $1261. Even a modest recovery from here would mean little. Gold needs to get back above $1269 per ounce to entertain new bullish positions.
The good news is, the longer-term undertow is still a bullish one. The alarming year-over-year comparison the World Gold Council served up today doesn't paint an accurate picture of gold's true supply/demand trajectory.
If you'd like to capitalize on the long-term and the short-term swings in gold using ETFs, the BigTrends ETF Options Trader Advisory Service is for you. It delivers about six trades every month, with holding periods of a week or less. That's the ideal timeframe for taking advantage of the behavior of exchange traded funds. Here's how to learn more.