by Price Headley
Stocks may have made a gain last week, but it was a hard-fought victory, and may have exposed just how vulnerable the market is right now. And, this week's trading will start out where last week's left off... within easy reach of some critical support levels, and in the shadow of still-waning momentum.
We'll discuss it all - and show you - below, right after a quick rundown of last week's and this week's major economic announcements.
Economic Data
Last week was a rather busy one in terms of economic data, though not a great deal of it was hard-hitting news. In fact, the only items of real interest were July's retail sales levels and last month's industrial productivity data from the Federal Reserve.
On the consumer spending front, compared to June's levels, retail sales grew 0.6% last month with cars, and were up 0.4% without factoring in auto sales. Overall retail sales were up 1.6% compared to July of 2014, and they grew 1.3% year-over-year on an ex-auto basis.
Retail Sales Chart
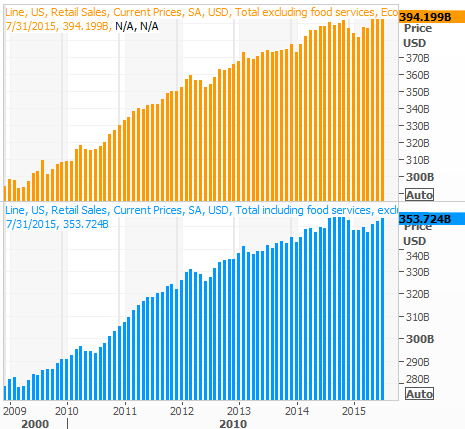
Source: Thomas Reuters
As for how busy our factories were last month, there's a clear improvement recently following the lull during the first half of the year. We're now using 78% of our output capacity, and factory production grew 0.6% in July.
Capacity Utilization & Industrial Production Chart
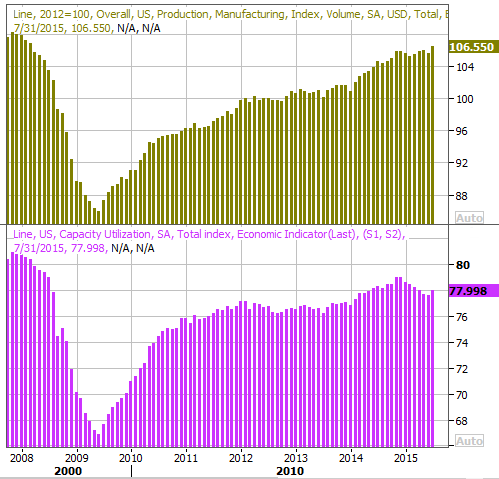
Source: Thomas Reuters
Everything else is on the following grid:
Economic Calendar
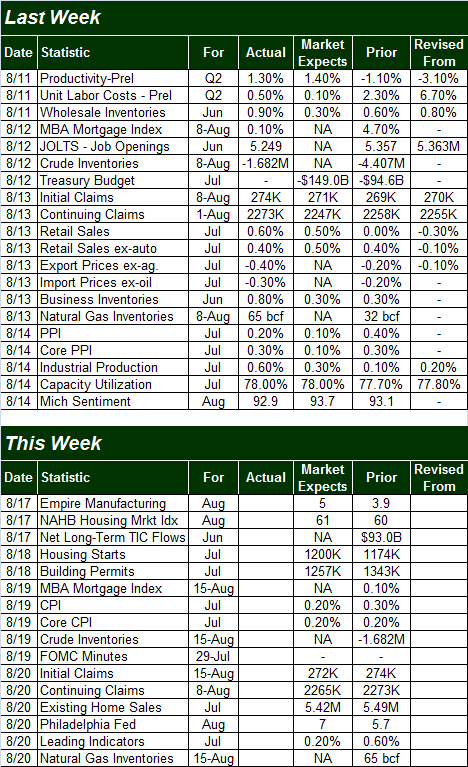
Source: Briefing.com
This week is going to be similarly busy, though the highlight is likely to be Wednesday's release of the minutes from the last FOMC meeting. Once again the market will seek to derive some meaning in the nuanced changes of the language the Fed uses to describe its plans on the next rate hike. The recent trend has vaguely pointed to a rate hike sooner than later, and little has changed in the meantime that would force Janet Yellen to lengthen that timeframe again.
It's also going to be a big week for the real estate market, and the home construction market in particular. We'll hear about July's starts and permits on Tuesday, and on Thursday we'll get last month's pace of existing home sales. The forecasted numbers appear on the calendar above, but the trends of these data sets are plotted on our chart below.
Home Sales Chart
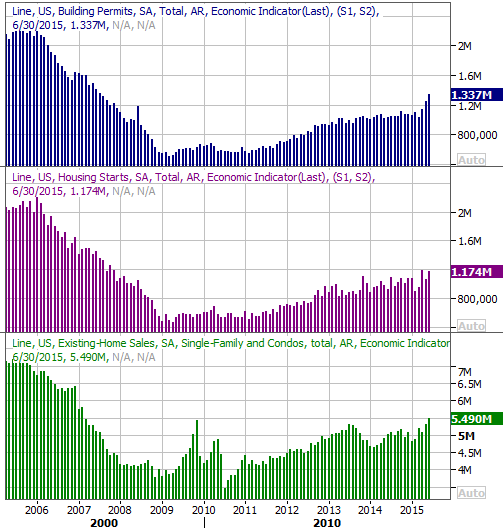
Source: Thomas Reuters
Stock Market Index Analysis
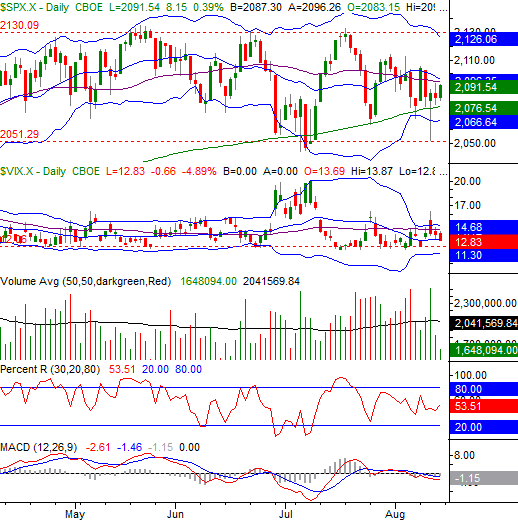
Though the market may have closed higher last week (and well above the deep lows made on Wednesday), it remains trapped between a rock and a hard place... between strong support and strong resistance. Though the bears have a technical edge, the issue is still largely an undecided one.
The chart of the S&P 500 clearly illustrates these two key themes. The resistance is being provided by the 20-day and 50-day moving average lines (blue and purple, respectively), while support is being found at the 200-day moving average line (green) and the lower Bollinger band (currently at 2066.64). Either the floor or the ceiling could break in the very near future. The good/bad news is, one or the other will have to break soon, since the floor and the ceiling are on a collision course. This could bring a much-needed end to what's become a long-lived stalemate.
S&P 500 & VIX Daily Chart
Chart created with TradeStation
As was noted though, the bears have the edge - the bulls will have to do the more dramatic maneuvering if a bullish outcome is to materialize.
We say that for two related reasons.
The first clue of a bearish undertow is the simple fact that not only are the MACD lines currently showing us a bearish divergence, but both MACD lines are now below the zero level. This hints at bigger-picture weakness.
The second bearish clue is the fact that both the 20-day and the 50-day moving average lines are both sloped downward now. In fact, the 20-day moving average line is on the verge of crossing back under the 50-day moving average line... again. This is another subtle sign that this recent weakness isn't just a bit of volatility - it's a developing trend.
The bullish counterargument is, Wednesday's bar (the day it looked like stocks fell off a cliff only to be followed by a huge intraday rebound) was a key reversal bar.
They come by different names, but the most common names for a day like Wednesday's is a hammer, or a dragonfly doji. They're simply characterized by an open and a close near the high for the day, with a very deep intraday low. The shape of this kind of bar suggest a flushout of all the would-be sellers, followed by a strong buy-in from all the bulls who've been waiting on the sidelines. Think of it as a proverbial changing of the guard, from a selling crowd to a buying one. Friday's gain underscores this idea.
The fact remains, however... the S&P 500 needs to get back above the 20-day moving average line currently at 2096.35 before we can seriously entertain bullish possibilities. Likewise, the 200-day average line at 2076.54 - and really last week's low of 2052 - need to fail as support before assuming the worst.
As evidence of just how "on the fence" stocks are, we only need to take a step back and look at the weekly chart of the S&P 500.
We've known for a while the broad market's momentum was waning. But, we've also known that momentum has yet to turn bearish. Each day of weakening bullish momentum, however, was another step closer to bearishness. For a while it looked like last week could be the pivot point, but the S&P 500 only needed to brush the lower 26-week Bollinger band to push itself back above its longer-term trend lines.
S&P 500 & VIX Weekly Chart
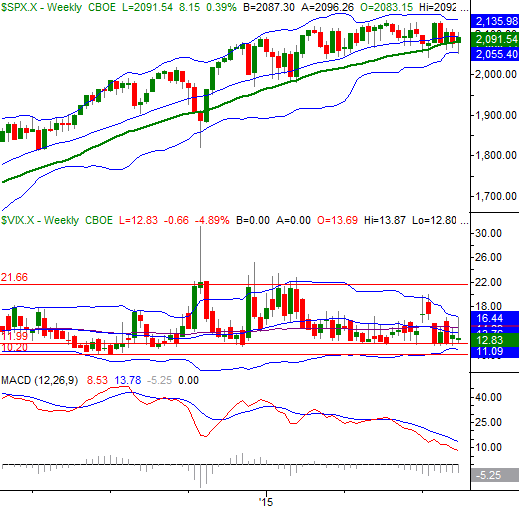
Chart created with TradeStation
All the same, we want to pay close attention to this chart because it's clearly telling us stocks are currently facing more of a headwind than they've faced in months. So far the bulls have at least held their ground, but we're close to moving past the tipping point. That being said...
A Correction May Not Be a Bad Thing Here
While it remains to be seen whether or not the brewing bigger-picture weakness is going to dish out any real damage, it may not be such a bad thing if it does.
As a reminder, between early August and mid-October of last year wasn't a great time for the market either, but that dip actually set up a huge fourth quarter rally. A pullback here and now would very likely do the same.
S&P 500 Chart, August through December of 2014
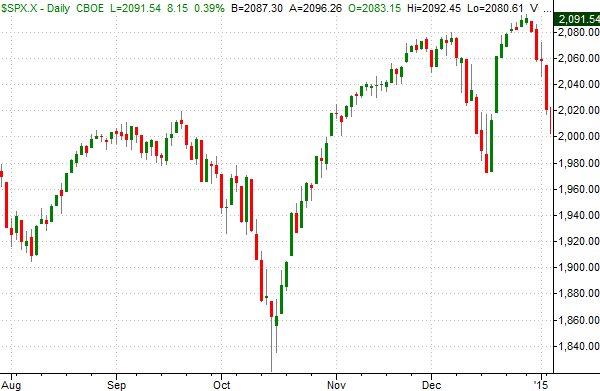
Chart created with TradeStation
It's also worth noting such a move at this time wouldn't be unusual. In fact, it would be unusual not to see weakness in August and September (and early October) as a setup for a strong finish to the last few weeks of the year. Here are the average S&P 500 returns for each month going back to 1950.
Monthly Return Chart
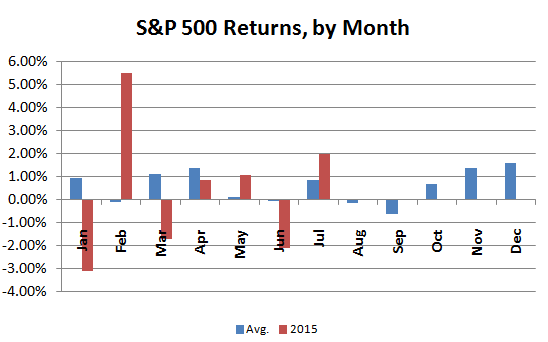
Source: MoneyChimp
Just something to think about if and when stocks do give us a sizeable selloff - history says it's ultimately a buying opportunity.
Trade Well,
Price Headley
BigTrends.com
1-800-244-8736