Between Monday's Rout and Tuesday's Rebound, Things Just Got a Lot More Interesting

- This week's volatility has better defined some key technical ceiling and floors, giving traders plenty to watch the rest of this week. -
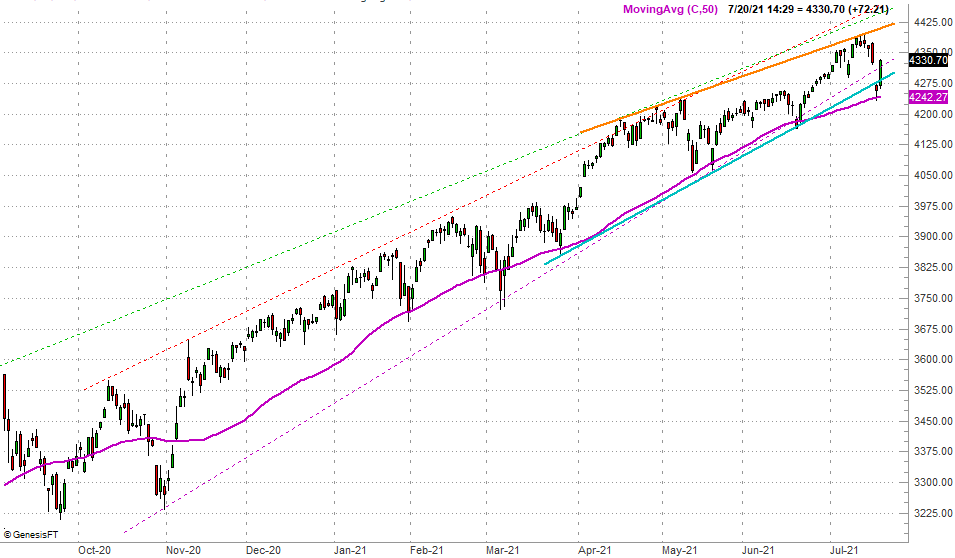
Monday's huge plunge from the S&P 500 clearly wasn't fun for the bulls, but in many regards it was a necessary evil. That day's low of 4233.13 confirmed the 50-day moving average line (purple) is serving as a floor, by virtue of prodding an intraday reversal effort that day, and setting up a huge rebound effort on Tuesday to close Monday's gap. That move pushed the index back into the middle of several different trading ranges that are now in play.
And that's not the only hint that the market is in a safer situation than presumed just a few days ago either. The NASDAQ Composite's previous technical ceiling around 14,188 (plotted in blue on our chart below)? That's since turned into a floor; resistance that turns into support tends to be a bit more meaningful. The composite also, unlike the S&P 500, still has a ton of room to keep running before bumping into the upper boundary of its long-term trading range, plotted with dashed lines.
Still, there are some red flags waving in the background that can't be ignored. Chief among them is the fact that, even before the marketwide drubbing started to take shape in early June, investors have quietly been thinking such a move was brewing. The evidence of this idea lies in the sectors that have performed well over the course of the past month, and which ones haven't.
Take a look. Energy, transportation, materials, and financials had led the market out of last March's implosion (even outpacing tech!) while safe names like staples, utilities, and healthcare have clearly underperformed. Since early June though - and especially since late June - healthcare, utilities, and staples have held their ground or even logged gains while materials, transports, energy, and financials have imploded. Technology stocks have raced to the head of the pack, but a closer look reveals that only the biggest and most popular tech names have logged these gains. Other, smaller, and lesser tech names have been hit just as hard as other stocks.
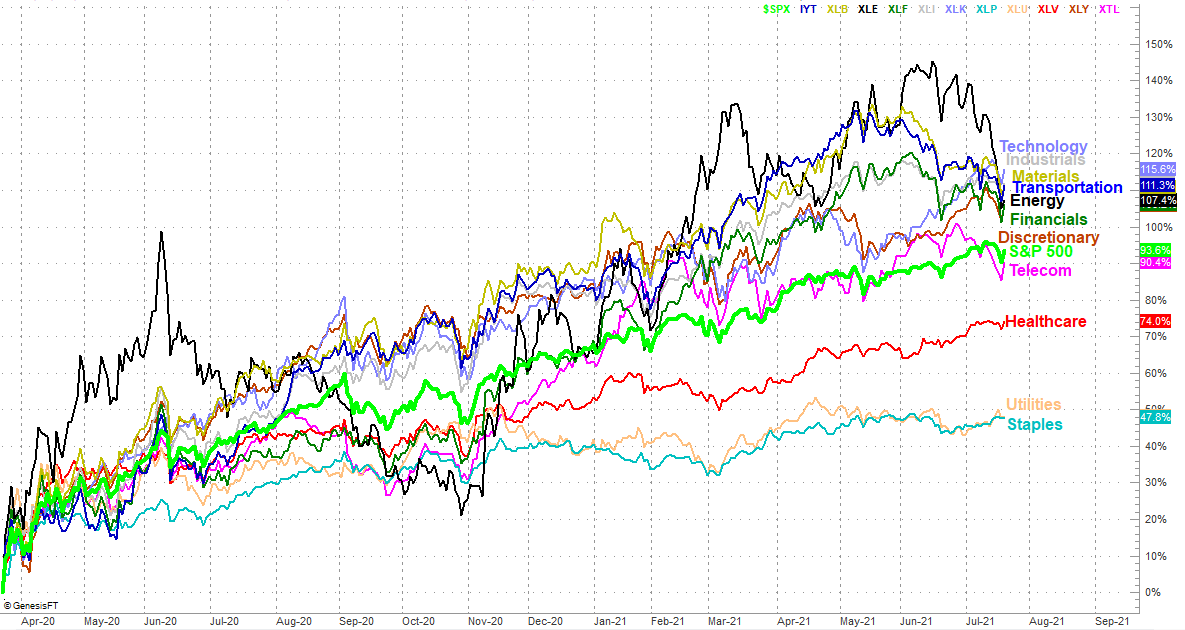
The underlying psychological hints of this leadership and laggardship matter. It's a hint that traders have quietly made their (slow) flight to safety at the expense of aggressive and riskier growth areas. If they've been mentally preparing for this shift, they're more prone to make it play out... a self-fulfilling prophecy.
Another curious red flag is the lack of volume behind Tuesday's advance.
Not that we'd demand to see a massive amount of volume behind the rebound to serve as confirmation that all is as healthy as could be. But, given the size of Tuesday's gains following the worst day for stocks in several months, if Tuesday's advance as an omen of what's to come we'd certainly expect to see more of a buy-in. To this end, notice that the NYSE's "up" volume has been trending lower since late June even though the market was actually moving higher from mid-June through Thursday of last week. In fact, the NYSE's advancers have been falling since mid-June, and its decliners have been rising for the same timeframe.
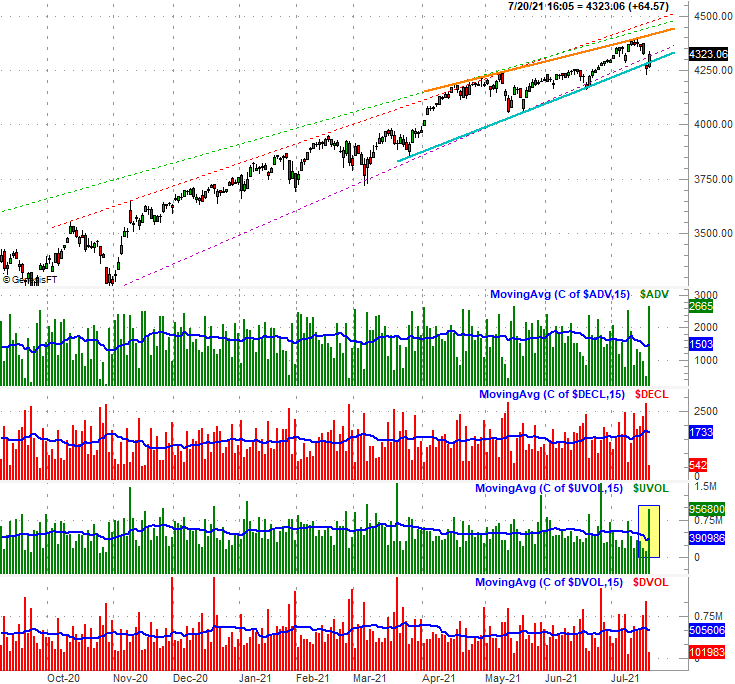
In other words, the only clear exception to this trend has been Tuesday, yet on the volume front, it wasn't much of an exception.
This isn't a call to action, bearish or bullish. Right now it's just a notification that things are finally starting to get shaken up. This could force the bulls or the bears to make a more binding commitment to a position rather than just merely coasting higher with this tide. In this same vein, the narrowing trading range that's been squeezing the S&P 500 toward a point will do the same, and do so sooner than later. The only thing to "do" right now is stand by and watch how this all pans out, and respond accordingly. That response may be merited before the end of the week.