A leading indicator for stocks is breaking down
Posted by jbrumley on November 9, 2017 5:16 PM
One leading indicator for the equity market is breaking below a key support level, a move that could have negative implications for stocks.
The iShares high-yield corporate bond exchange-traded fund, the HYG, has fallen below its 200-day moving average, which it had held above for much of this year. This move concerns Matt Maley, equity strategist at Miller Tabak. Here's why.
- The high-yield market has begun selling off in the past week, Maley wrote in an email to CNBC, leading the HYG to decline. As the 200-day moving average has proved solid support for the ETF, "this raises some concerns in my mind," he wrote.
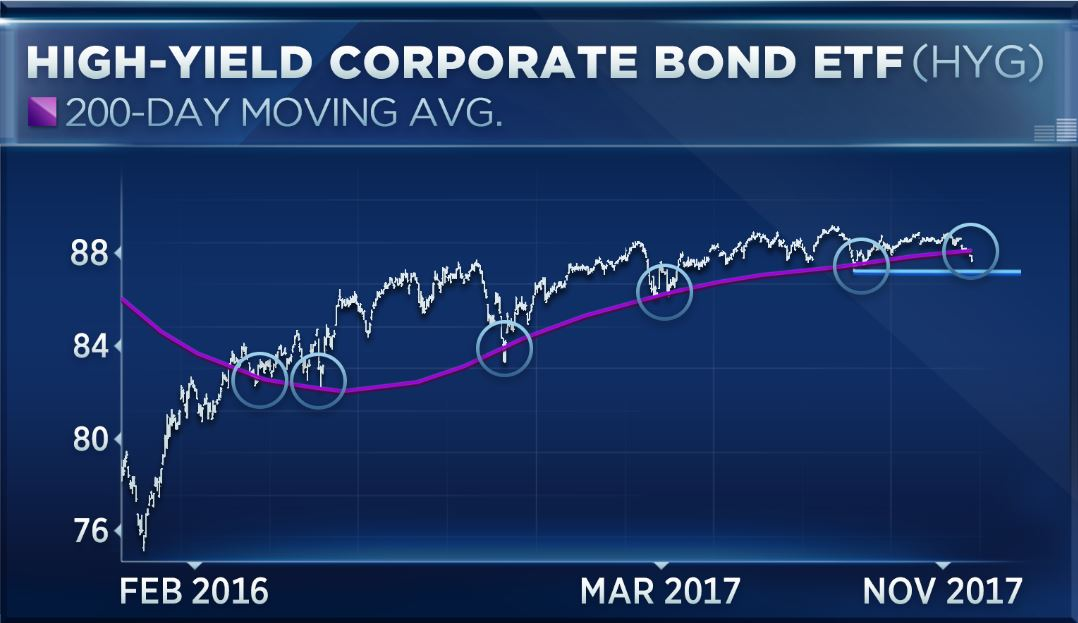
- However, it would have to fall below its August lows of 87.15 to "raise a yellow warning flag on this asset class," he added.
- While the drop below the moving average is not a major problem just yet, he said, he'll be watching closely to see if the market shows further signs of weakness in the weeks ahead given the ETF's record as a strong leading indicator for stocks.
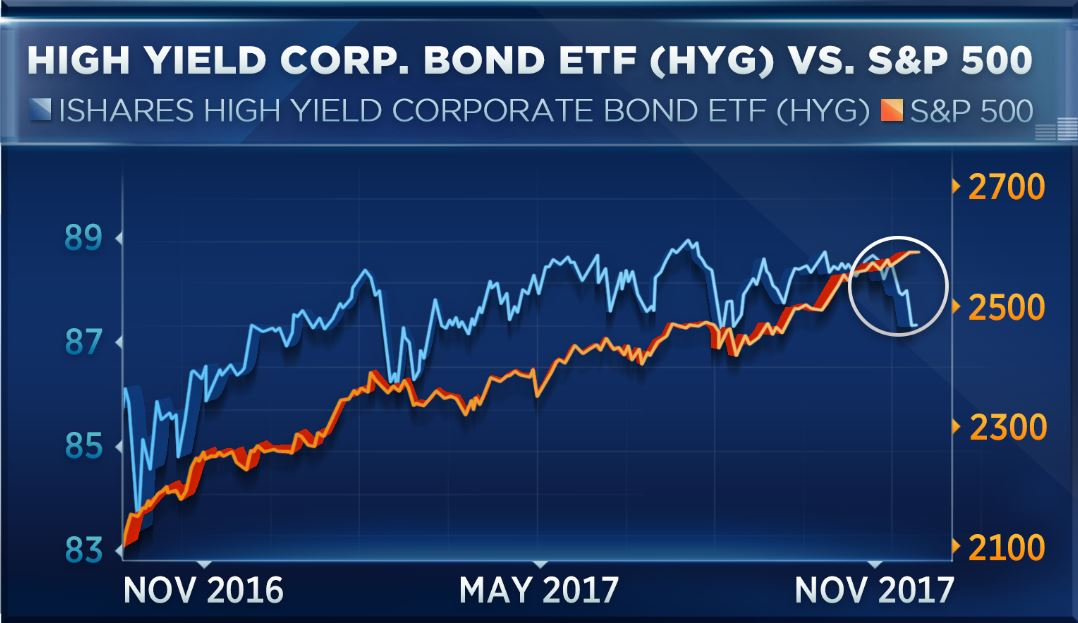
- The HYG and the S&P 500 have been closely correlated since late 2015, and the ETF is barely positive on the year.
Bottom line: The high-yield market is beginning to flash a warning sign for the broader market.