Weekly Market Outlook - The Bulls Continue to Scrape and Claw

It wasn't pretty, easy, or impressive, but stocks logged yet-another move into record high territory last week. All told, the S&P 500 tacked on gains of just under 1% over the course of the prior five trading days to close at 4436.52 on Friday. A great jobs report for July helped things end on a high note.
Will it continue? Can it continue? Both matters remain up the air. Doubts about the future of this rally certainly aren't unmerited though. Not only is the advance getting a bit long in the tooth, it's slowing down... right around where we'd expect it to.
We'll take a detailed visual look at it in a moment. First let's recap last week's biggest economic announcements and preview what's in the cards for this week.
Economic Data Analysis
There's no sense beating around the bush. Last week's biggie was Friday's jobs report. Despite the disappointing payroll growth number from ADP on Wednesday, the Department of Labor reported the country added (or recovered) 943,000 jobs in July versus expectations of 925,000, and following June's upward-revised tally of 938,000. That was enough to dial the unemployment rate from 5.9% to 5.4%. The market responded mostly bullishly, but modestly.
Payroll Growth and Unemployment Rate Charts
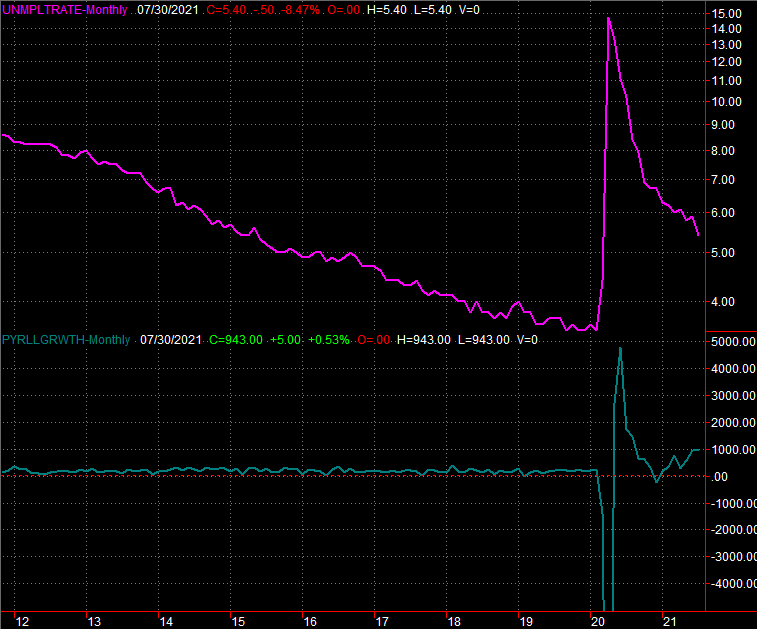
Source: Department of Labor, TradeStation
It's an encouraging step, though firmer employment only bolsters the inflationary pressure. It's possible for payroll growth to be taking shape too quickly. Whatever the case, we're making much-needed progress on the jobs front.
The only other item of interest from last week's was the dual updates from the Institute of Supply Management. The services index jumped from 60.1 to a multi-year high of 64.1, though the manufacturing index tumbled back to a multi-month low of 59.5.
ISM Services and Manufacturing Charts
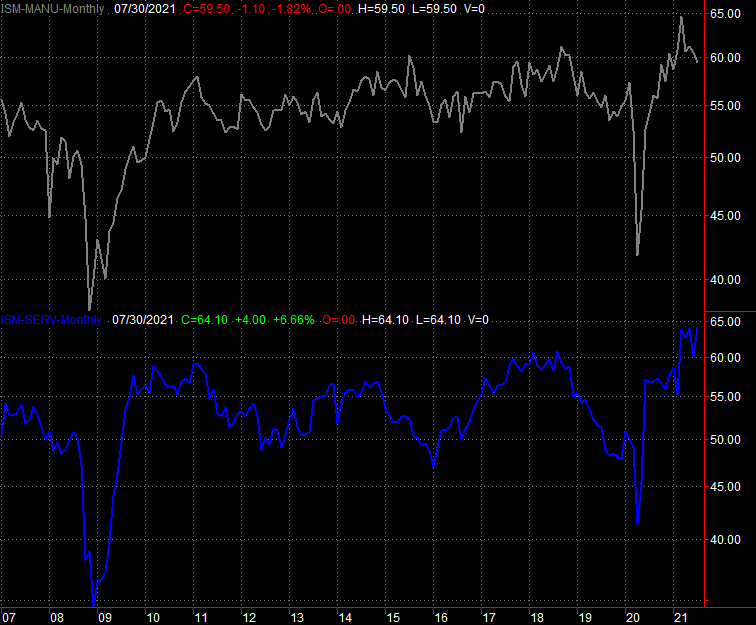
Source: Institute of Supply Management, TradeStation
That's still above the critical 50 level, but the trajectory is a little concerning. Perhaps demand for goods spurred by the economic recovery is already leveling off, and/or higher prices are finally giving consumers pause.
Everything else is on the grid.
Economic Calendar
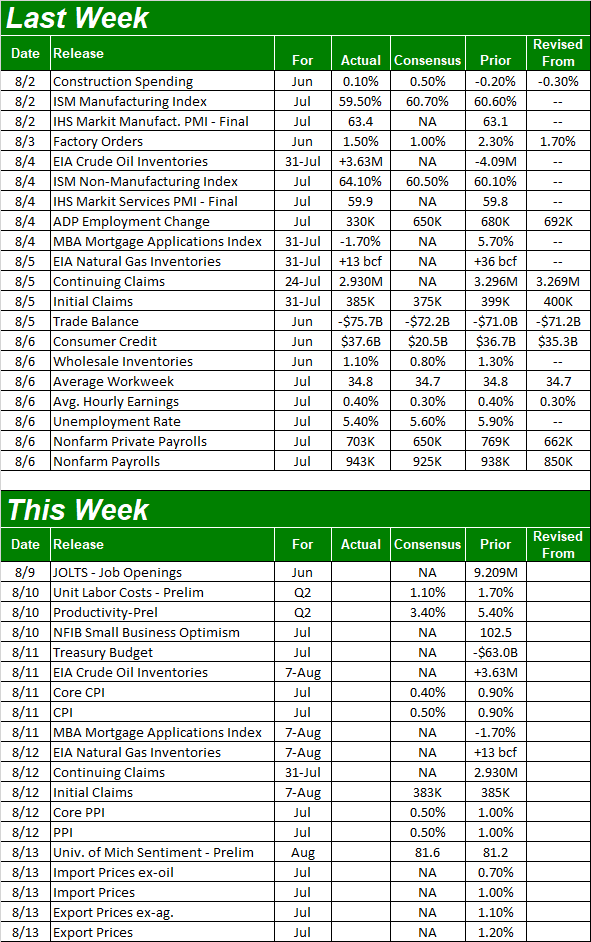
Source: Briefing.com
This week will be lighter. In fact, the only data set of interest is the inflation update due from the Bureau of Labor Statistics.
You already know inflation has soared to out-of-control levels, with all those stimulus dollars issued finally making their inevitable impact. The current consumer inflation rate now stands at 5.4%. Economists expect price increases to start slowing, but they're still projected to grow quite a bit from already-lofty levels.
Inflation Rate Charts
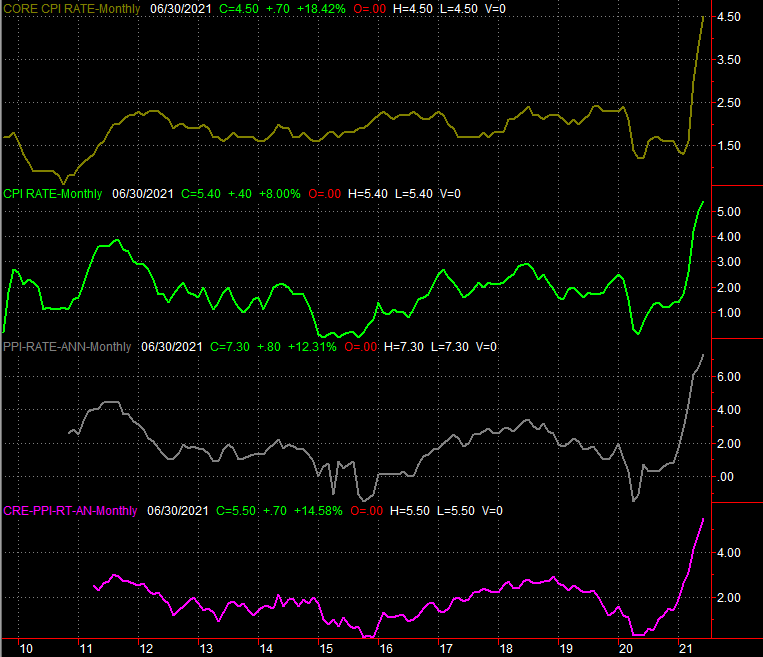
Source: Bureau of Labor Statistics, TradeStation
Of course, we're headed into the thick of earnings season, so the market will have plenty to contend with in addition to inflation data.
Stock Market Index Analysis
Yes, the stock market logged gains last week. The S&P 500 ended the five-day stretch up around 1.0% after pushing up and off of its 20-day moving average line (blue) on Tuesday, renewing the bigger uptrend. Don't get too terribly excited though. The index remains below a technical ceiling that connects all the key highs going back to April (highlighted). Take a look.
S&P 500 Daily Chart, with VIX and Volume
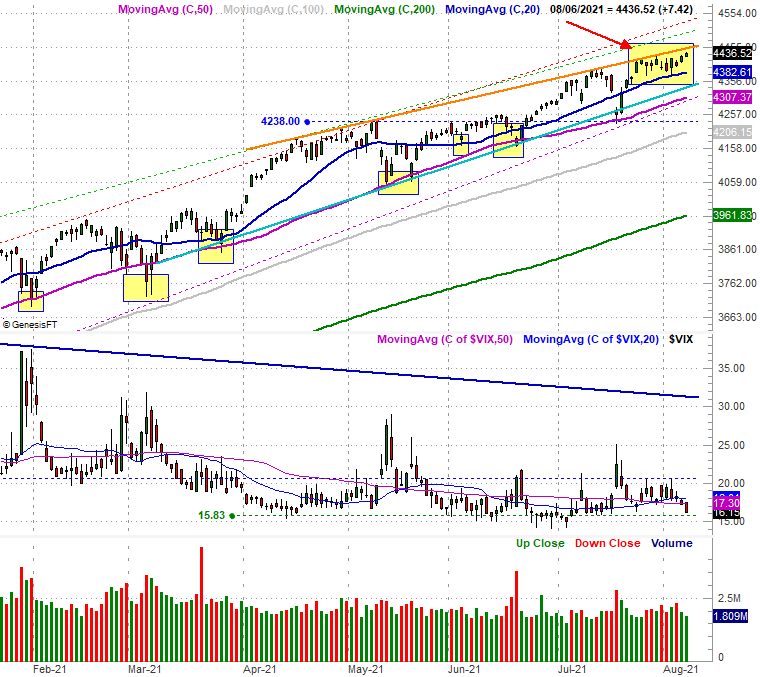
Source: TradeNavigator
But, maybe that's the best thing for stocks here. As much as traders collectively, quietly wish for a faster, bigger breakout, perhaps its this slow pace that's allowing the rally to remain alive.
In this vein, the NASDAQ Composite's bullishness is also being capped by clear technical resistance... just not the same resistance. The NASDAQ's ceiling is made up of all the highs hit each week for the past five week. That still leaves it well below the ceiling consisting of peaks hit in February, last September, and the highs from early last year before the pandemic up-ended stocks (red, dashed). As was the case for the S&P 500, perhaps this more muted bullishness is the key to the rally's longevity.
NASDAQ Composite Daily Chart, with VXN
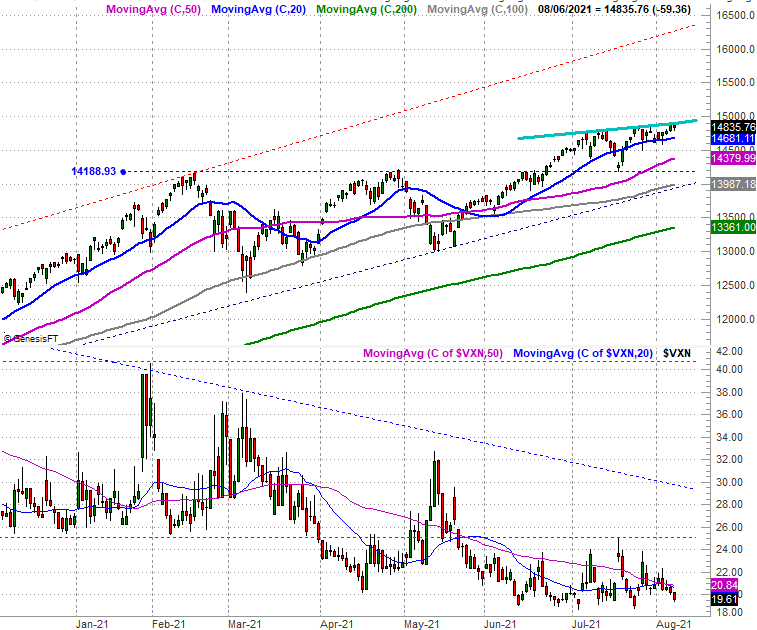
Source: TradeNavigator
Here's the weekly chart of the NASDAQ Composite, for a little added perspective.
NASDAQ Composite Weekly Chart, with VXN
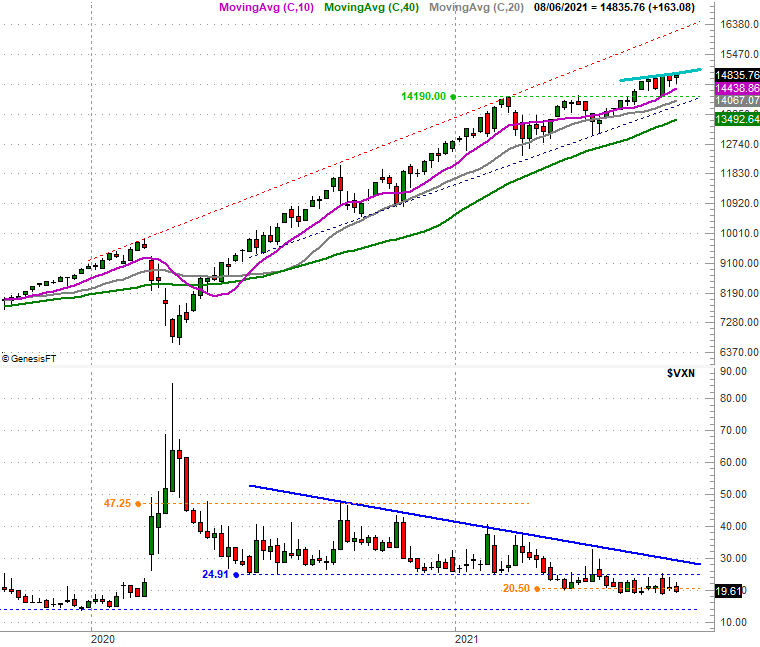
Source: TradeNavigator
Of all the charts we want to zero in on this week, however, it's the weekly chart of the S&P 500. It's showing us something worth seeing, even if not many people have cared to notice it.
Ever heard of a converging wedge pattern? In simplest terms it's a triangle shape on a stock chart defined by resistance and support that are on a course to intercept one another. Stocks bounce back and forth between floors and ceilings all the time, so there's nothing unusual in this "ranging." But, there comes a time when there's no more room to travel between these boundaries. A stock or index is forced to move above resistance or below a floor. Often, those moves turn into prolonged efforts.
With that as the backdrop, take a step back and fully appreciate the converging wedge pattern the S&P 500 is making. There's actually more than one set of support and resistance lines, although the ones we're most interested in are the newest ceiling (orange) and the most recent floor (blue). There's just not a lot of room left to bounce around in. A break outside of these confines is brewing, sooner or later, and sooner than later.
S&P 500 Weekly Chart, with VIX and Volume
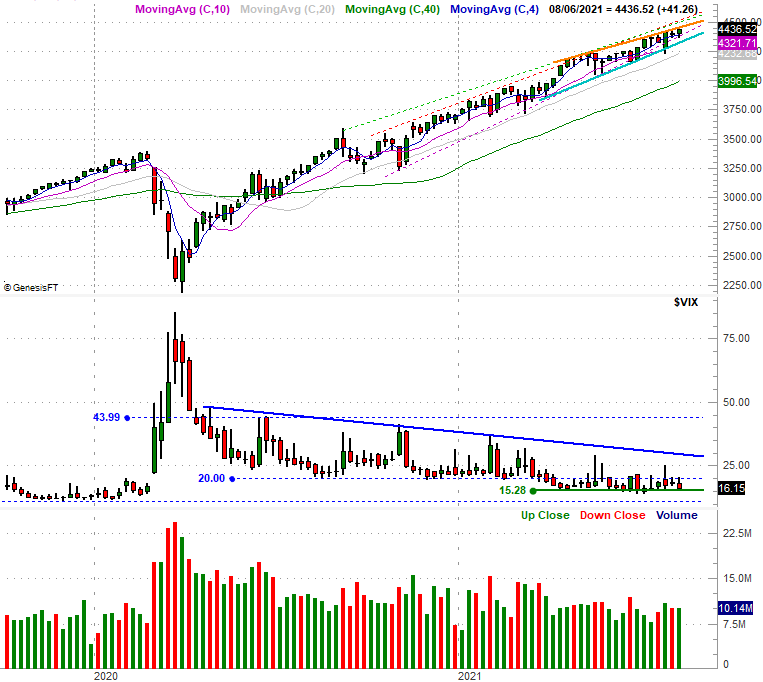
Source: TradeNavigator
Which direction will that move be? That's just it. Nobody really knows. We do know, however, that a thrust out of these narrow confines is brewing. We also know that most rising converging wedges tend to lead into a bearish, corrective move. Again though, we're not seeing any evidence that this is taking shape just yet. The key is (still) that move below the light-blue line acting as a floor for the S&P 500, and even then there's another thick layer of support just below that.