Screening For Stocks Using Average True Range & Other Factors
Screening For Stocks Using Average True Range & Other Factors
Courtesy of TradersLaboratory
[BigTrends.com note: This is a nice article that discusses a systemized way to find trading ideas and stocks/ETFs that will move enough to make a trade worthwhile. It focuses on a formula for Price/Average True Range as a way of measuring volatility on an individual stock/ETF trading and screening for ideas -- however, this somewhat ignores the options trading available on most liquid stocks. Options have an implied volatility in them which takes into account the underlying volatility/true range/etc, which makes them more of an 'even playing field'. Meaning a volatile stock will have expensive options with a lot of time premium in them, while a non-volatile stock will have very cheap options with very little time premium. The Delta of an option will tell you approximately how much bang-for-the-buck you will get on that option at a particular point in time. Not to mention the leverage that you can receive on an option with a small cash outlay, compared to trading the underlying stock - sidenote, more expensive stocks/ETFs will normally have more expensive options on a real dollar basis than a low price stock/ETF.]
Scanning for reliable chart patterns is obviously one of the most important factors that determines which stocks and ETFs traders should buy. However, just because a stock has a bullish chart pattern does not mean you should automatically consider buying it.
In addition to assessing overall market conditions, you must also determine if every potential stock trade also has the proper amount of volatility and liquidity. Read on to learn how to consistently choose only stocks with ample volatility, liquidity, and reliable chart patterns (the "triad of trading profits"), which directly impacts your long-term trading gains.
The Perfect Balance
In our style of stock trading (short to intermediate-term swing), we look to trade with the prevailing trend, which is usually in the direction of the 50-day moving average. When the market is in trend mode to the upside, it is important to expose our capital to as many bullish situations/setups as possible, in order to maximize trading profits.
To do so, we focus on swing trading stocks that are volatile enough to produce gains of 20% or more in a short period of time, which allows us to rotate the portfolio, and again, maximize profits. Nevertheless, the process is not as simple as building a portfolio of the most volatile stocks in the market and letting the chips fall where they may.
The goal in selecting the best stocks to buy (in a bullish market) is to achieve the perfect balance between volatility, liquidity, and reliable chart patterns.
Finding The Triad
How we screen for a stock that has the winning triad of volatility, liquidity, and chart pattern reliability is actually easier than it may sound.
Volatility
To determine the true volatility of a stock, we utilize a simple and highly effective formula known as the Price/ATR Ratio.
When using a trading platform like TradeKing or TradeMONSTER (get free trades for 60 days), we start by displaying the ATR (average true range) of a stock. An objective, technical measurement of a stock's volatility, ATR is calculated as the greatest of the following:
*current high less the current low
*the absolute value of the current high less the previous close
*the absolute value of the current low less the previous close
Put another way, ATR basically measures the average intraday trading range of a stock. We use a 40-day ATR, which tells us the average daily volatility of a stock, as averaged over the past 40 days. To balance out the effect of higher priced stocks automatically having a greater trading range because of their high prices, we next divide the last price of a stock by its 40-day ATR (average true range).
For example, if a stock with a $40 share price has a 2-point ATR, it trades at 20x its ATR ($40/2). A $40 stock with a 1 point ATR trades at 40x its ATR ($40/1).
With this ratio, a lower number indicates a more volatile stock than a higher number (which is better for momentum swing trading).
When dividing the stock price by its ATR (Price/ATR Ratio), 40-50 is roughly an average number where most stocks will fall. However, we prefer to trade stocks with a 20-50 Price/ATR ratio. A stock with a ratio above 60 is usually (not always) too "slow" to trade. Conversely, a stock with a Price/ATR Ratio below 20 means the stock may be a bit too volatile for our tastes.
Liquidity
The second component of scanning for suitable stocks to trade is liquidity. To qualify as a potential swing trade with full position size, individual stocks should trade with a minimum average daily volume of at least 1 million shares.
Some stocks we trade have far less than 1 million shares per day changing hands, but we always reduce our position size in such a situation. Higher priced stocks are ideal, as they allow funds to maneuver in and out of trades with ease, and you should never avoid a high-priced stock, even with a small trading account.
Note that our requirement for 1 million shares per day is only for individual stocks; we have a much lower requirement for ETFs, as high average daily volume is largely irrelevant when trading ETFs.
Reliable Chart Patterns
The final component in the triad of stock selection is subjective and deals with spotting good-looking charts that can produce low-risk, reliable buy entry points. Fast-moving stocks require low-risk entry points, which allow us to minimize risk and maximize the reward to risk ratio for each new swing trade entry.
This article is not about how to find the best and most reliable chart patterns, but this article will point you in the right direction for the third element of finding the top stocks to buy.
Volatility & Liquidity In Action
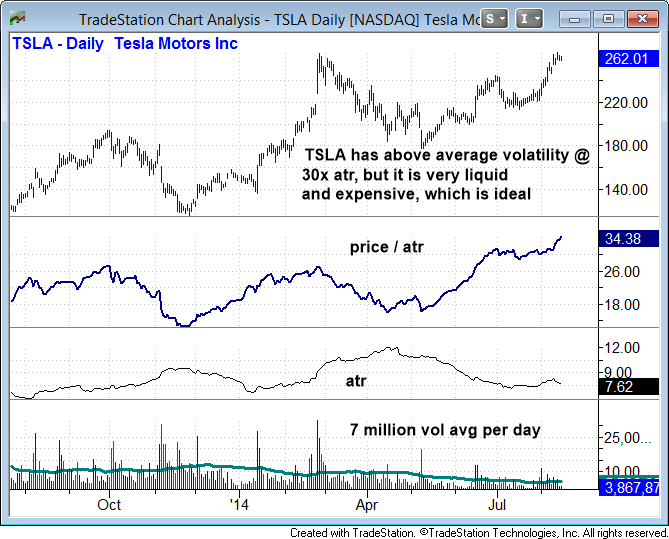
Based on our system, Tesla Motors (TSLA) is an ideal stock with a Price/ATR Ratio in the 30s and plenty of liquidity:
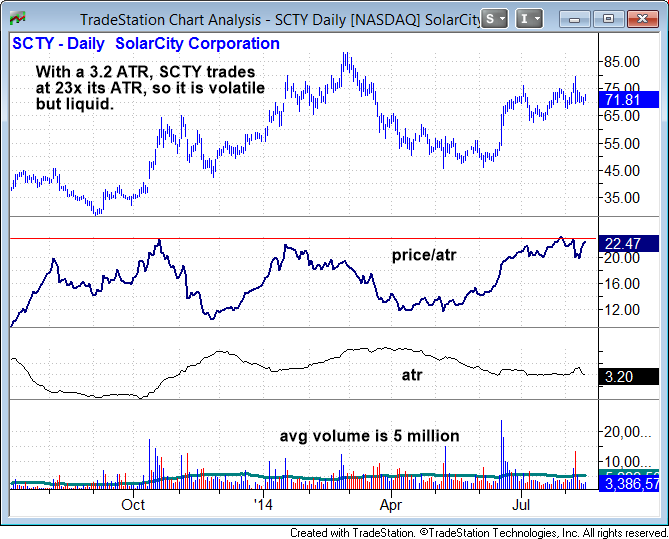
Another solid stock to trade is SolarCity Corp. (SCTY), which is nicely volatile with a Price/ATR Ratio of just 23:
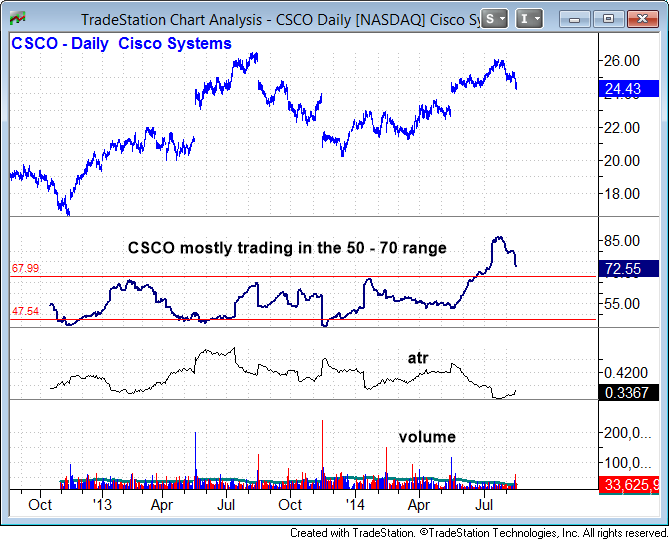
With a Price/ATR Ratio of more than 70, Cisco Systems (CSCO) is too slow for us and is an example of a low-volatility stock we would not look to trade:
With individual stocks, we usually pass on trade setups with a Price/ATR Ratio over 50.
The ratio can be a bit higher for ETFs, which are generally slower-moving than stocks, but you should avoid ETFs trading with a Price/ATR Ratio of more than 80-90.
The iShares Long-term T-Bond ETF (TLT) is, for example, an ETF we would typically not look to trade. Although it is high-priced (which is generally good), it has a very low ATR. As such, the ETF trades at a price of 118 times its ATR.
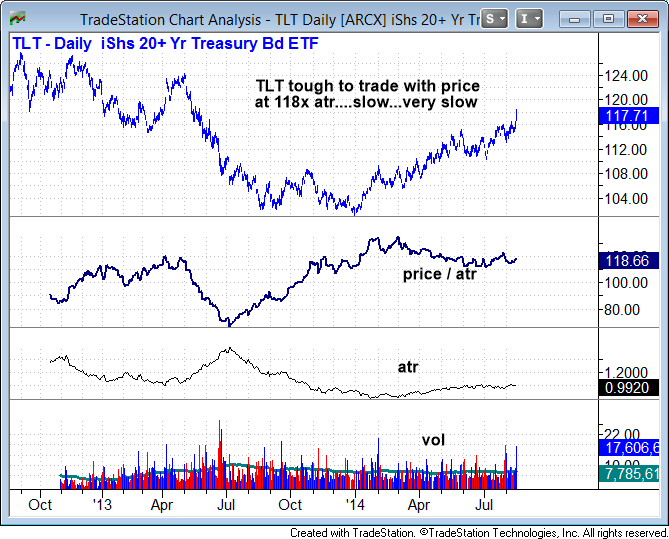
With a Price/ATR Ratio of 118, TLT is simply too slow to trade:
Are You Maximizing Your Potential Trading Profits?
Unless you have the luxury of a trading account with virtually unlimited funds, it is crucial to scan for stocks that provide you with the most potential "bang for the buck" (highest profit potential when they take off). Although there may be hundreds of stocks with nice-looking chart patterns in a typical bull market, getting in the habit of checking for ample volatility (Price/ATR Ratio) and liquidity is an excellent way to further narrow down your arsenal of potential stock trades to consider.
by MorpheusTrading