Where We Stand Now After The Volatility - Weekly Market Outlook
Where We Stand Now After The Volatility - Weekly Market Outlook
It wasn't an especially stellar week for the market, but a gain is a gain. Even a small gain is better than a loss, right? Yet, it still seems as if the rally is running out of steam, with investors hesitant to keep pouring in when the market is this technically overbought in the near-term, and perhaps too overvalued for the long haul.
We'll take our usual look in a moment, right after dissecting last week's and this week's most important economic information.
Economic Data
While we processed several economic data points last weeks, there's little doubt that the biggest and most important information was unveiled on Friday. We're talking about October's employment snapshot. The employment numbers were encouraging... even the numbers you didn't hear about.
What you do know: The U.S. economy added (net) 214,000 new jobs last month. It was shy of expectations, and shy of September's job growth of 248,000 new payrolls. But, it was enough to move the unemployment dial down from 5.9% to 5.8%. Wages were up a bit (+0.1%), and the average workweek held steady at 34.6 hours.
What you don't know: The improvement in the unemployment rate wasn't just some happy circumstance where the number of people who dropped out of the official workforce plunged by millions, thus artificially making the unemployment rate number drop. The workforce actually grew last month. It's just that the number of workers grew even more. All told, 147.3 million people are employed now, out of 156.3 million being counted in the labor force. Both figures are up from September's levels of 155.9 million and 146.6 million, respectively. Although participation rates are still just off multi-year lows and the number of people who are not in the labor force but still wants jobs ticked higher by about 200,000 last month, overall we continue to see progress on the jobs front.
Employment Trends Chart
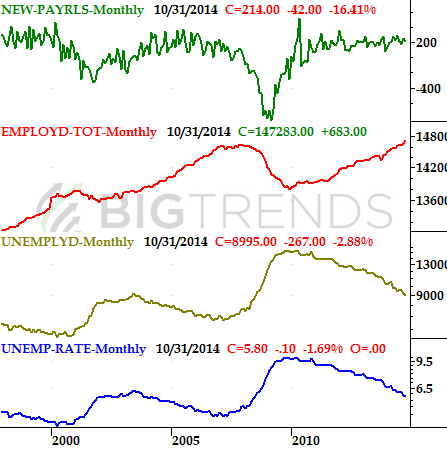
Source: Department of Labor/Bureau of Labor Statistics
Jobs news wasn't the only economic data released last week, however. We actually kicked off the week with Monday's ISM Index reading, and followed that up with Wednesday's ISM Services Index. These measure economic activity by surveying manufacturing and non-manufacturing companies. The former ramped up from 56.6 to 59.0, while the latter rose fell back from 58.6 to 57.0. While both indexes are broadly rising, both are also still too choppy to deem hyper-reliable indications of economic strength.
ISM Index and ISM Services Index Chart
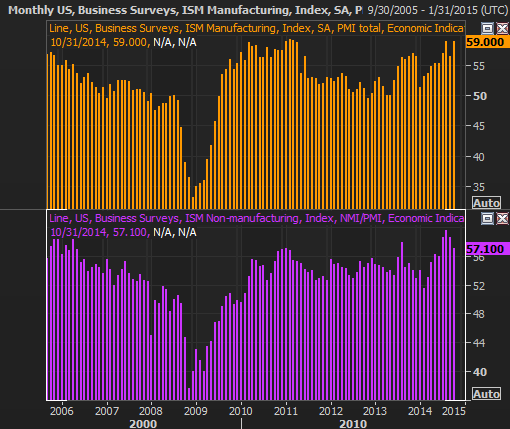
Source: Thomson Reuters Eikon
Finally, on Tuesday we heard about September's factory orders. The fall of 0.6% wasn't an encouraging step, particularly after August's steep 10.0% decline. It's data we need to keep an eye on going forward, though it's worth mentioning the durable goods orders data - relatively similar to factory orders - is showing a much more encouraging trend.
Here's the rest on the following grid:
Economic Calendar
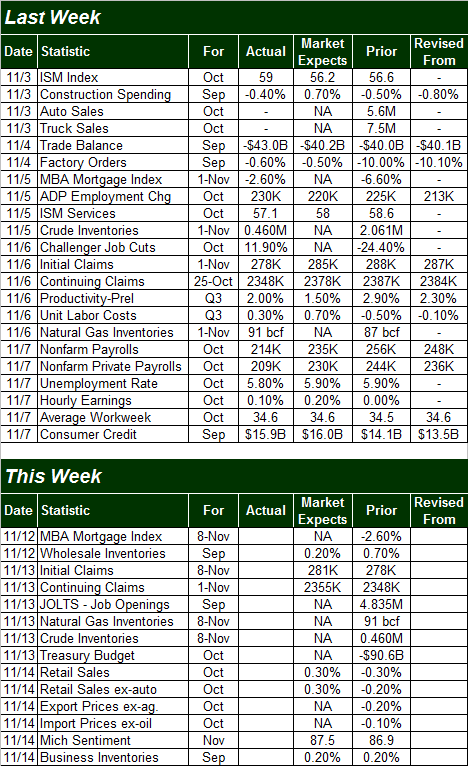
Source: Briefing.com
The coming week won't be quite as busy, nor as hard-hitting. In fact, the only data of any real interest to us is Friday's retail sales figures for October. You may recall September's retail sales results weren't all that thrilling, down 0.2% without automobiles, and lower by 0.3% counting cars... both on a month-to-month basis, however. On a year-over-year basis, the trend is still positive. Either way, things should be better this time around, with the pros looking for a 0.6% improvement on both. One bad month shouldn't rattle the market too much, though it's worth noting the overall retail spending trend is broadly tapering.
Retail Sales through September, YOY Change Chart
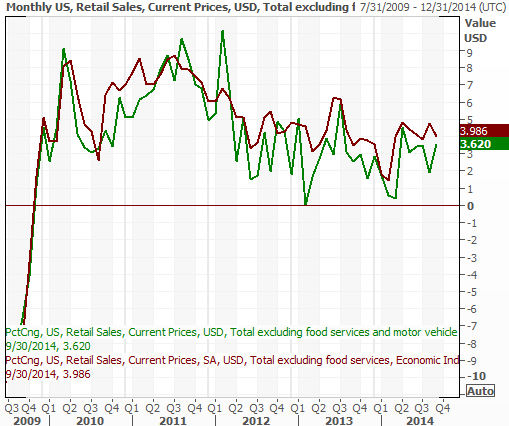
Source: Thomson Reuters Eikon
Stock Market Index Analysis
Though the rally got was a little wobbly getting restarted early in the week last week, the S&P 500's (SPX) (SPY) break above 2010 from two Friday's ago ended up meaning something later last week. When all was said and done, the large cap index ended up gaining 13.87 points last week - a 0.68% advance - to close at a record-high close of 2031.92.
It's too soon to begin the celebration, however.
Yes, the S&P 500 is making higher highs and the CBOE Volatility Index (VIX) (VXX) has finally started to make lower lows after stalling at 13.8. Take a look at the lower part of this week's chart of the S&P 500 though. There's a bit of waning momentum on the MACD chart, and the momentum line is clearly pointed downward now. We could sense the velocity of the rally was slowing, but the MACD and momentum indicators confirm it.
S&P 500 & VIX - Daily Chart
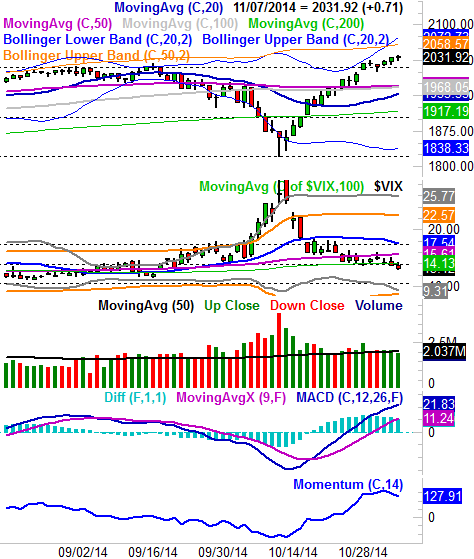
All charts created with TradeStation
Also notice that volume of late, though not weak, hasn't been particularly strong in this last leg of the rally either.
Realistically, the S&P 500 could coast a little higher; there's certainly room for the VIX to drift a little lower. At the very best, however, the S&P 500's upper 50-day Bollinger band at 2058 should be a ceiling, and the VIX will contend with a floor of its own at 10.00. If either index manages to reach those target levels - and we may not even get a chance to do that - it would be wise to start planning on at least some sort of decent-sized reversal.
A look at the weekly chart of the S&P 500 doesn't tell us anything new, but once again it does add some perspective. It's in this timeframe the sharp V-shaped reversal (from the VIX as well as the S&P 500) becomes clear. It's also in this timeframe, however, we can see the volume behind the rally was never outstanding, and has been getting progressively weaker. It's also in this chart we can see the market is right back to key ceilings that have slowed it down - even if not stopped it - in the past.
S&P 500 & VIX - Weekly Chart
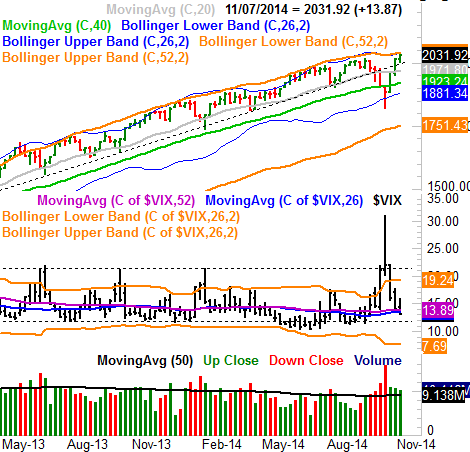
Bottom line? Watch that 2058 area on the SPX as potential resistance for the SPX and the other major broad stock market indices (DIA) (QQQ) (IWM). The former ceiling at 2010 is now potential support and is in general a key level if we pull back a bit. Below that, the big floor to worry about is 1968, where the 50-day moving average line and the 100-day moving average line have converged, and where the 20-day moving average line will soon be. That's going to be a monster of a make-or-break level for stocks if we reach that, and is an important one in the grand scheme of things. Just know that a retest of the 1968 level still leaves the market open to about a 3.2% slide.
The ongoing wrench in the works - for the bulls anyway - is the market's valuation. The trailing P/E for the S&P 500 now stands at 17.69, and the forward-looking P/E is around 15.7. That doesn't leave a lot of room for upside that even the most generous of investors could justify.... maybe a 12% to 13% gain over the course of the coming year, on a valuation basis. It will either mean a very slow gain over the coming year, or a more sizeable setback than the one we saw in early October unfurling in the foreseeable future.
Trade Well,
Price Headley
BigTrends.com
1-800-244-8736