Positive Momentum, Overhead Resistance & Valuations - Weekly Market Outlook
Positive Momentum, Overhead Resistance & Valuations - Weekly Market Outlook
Last week was the first winning week in the past five, and the bulls more than made up for lost time. When all was said and done, the S&P 500 (SPX) (SPY) advanced 4.1% last week, putting it back at its pre-meltdown level. It remains to be seen if stocks are here to stay, and ready to remain in an uptrend - in the short run, they're very overbought. But, the pivot from two weeks ago was a decisive one, and there's still room to run higher. It's just a matter of timeframes as to whether or not you'd want to jump in this week.
We'll weigh the risks and odds in a moment. First we need to dissect last week's economic numbers.
Economic Data
It was another important week on the real estate front, with reports of existing home sales, new home sales, and the FHFA housing price index all coming out. In a nutshell, they were all good. The pace of existing home sales was ratcheted up to 5.17 million (the strongest rate in a year), while new home sales hit an annualized clip of 467,000, up from August's reading of 466,000. The FHFA also reported the price of homes ticked higher from August's levels, by 0.5%. Following last week's modest improvements in housing starts and building permits, we can see with some pretty good confidence that the overall real estate trend remains reasonably positive.
Real Estate Trends Chart

Source: FHFA, Census Bureau, Standard & Poor's, and National Assn. of Realtors
The only missing piece of real estate data we care about is the Case-Shiller Index for August, which is due on Tuesday. It's been in an uptrend too, however, and that trend should be extended for August.
Note that inflation remains muted. As of the end of September, the annualized consumer inflation rate stood at 1.66%, marking the fourth straight month of decline.
Consumer Inflation Chart
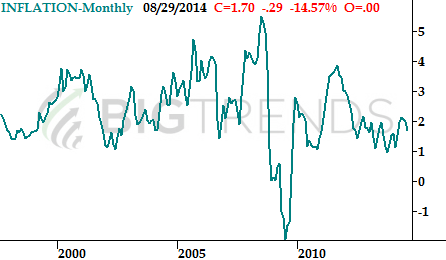
Source: Bureau of Labor Statistics
Everything else is on the following grid:
Economic Calendar
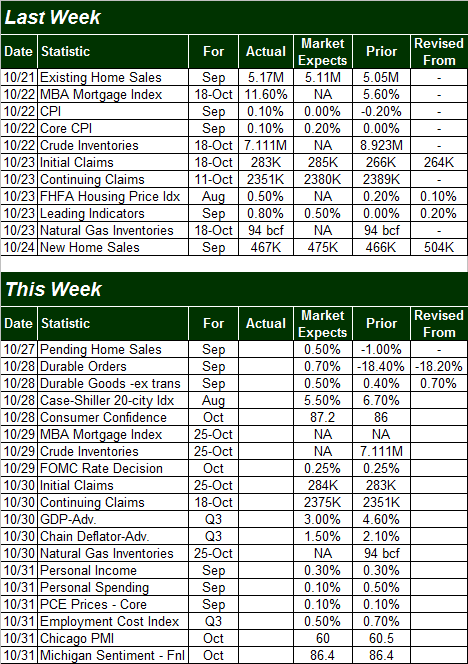
Source: Briefing.com
The coming week is going to be considerably busier, though not a great deal of what's in the economic release queue is likely to be market moving in a big way. Earnings seasons continues this week.
Wednesday is a big day, as we'll hear from the Federal Reserve about any decision to change interest rates. It's unlikely we'll see any changes from the 0.25% figure on its key interest rate, however, especially with inflation rolling in at weak levels and deflation on the horizon. The Fed should also be wrapping up its bond-buying program soon.
We're going to hear the first (of three) estimates of Q3's GDP on Thursday. It's unlikely we'll see a repeat of Q2's 4.6% increase, but the anticipated 3.0% rise would be solid. That said, if we fall significantly short of that target, it could create some turbulence for stocks.
Durable orders could move the needle a little when we get that figure on Tuesday, but only if we don't get that expected 0.7% increase overall, and the expected 0.5% uptick without transportation orders.
It's going to be a big week on the consumer sentiment front, with the Conference Board's consumer confidence reading for October out on Tuesday, and the Michigan Sentiment Index score (final) scheduled for release on Friday. Both sentiment scores have been in long-term uptrends, and the pros expect both to extend those uptrends this time around.
Consumer Sentiment Trends Chart
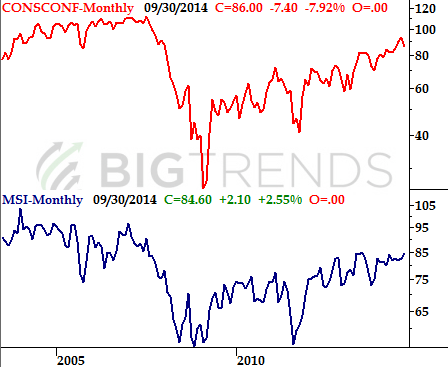
Source: Conference Board and Reuters
Stock Market Index Analysis
Just to set the stage a little before getting to the nitty-gritty, last week's bullish follow-through on the prior week's reversal effort was plenty convincing. Yet, it was suspiciously stopped short at some key moving average lines (potential ceilings), and the gain itself last week - a 4.1% pop for the S&P 500 - may have been too big of a gain for the bulls to feel comfortable adding to.
Indeed, the lack of (and increasingly weak) volume on the way up last week may be a sign that this particular burst has all but come to a close. The question from here is, will any possible pullback turn into a full-blown meltdown, or will it just be a much-needed lull to let the bulls regroup and restart. Another big question is the other possibility... how far might the market be able to climb in the less likely event of a break above last week's moving average lines/ceilings?
With that as the backdrop, let's begin the detailed analysis with a look at the daily chart of the S&P 500. As is plain to see, the index made sizeable gains in four out of the past five trading days. Yet, the rally effort was stopped cold somewhere between the 50-day and 100-day moving average lines. It's a cause for concern, as both have proven themselves to be ceilings and floors in the past. It would be a perfect place for the bears to pull the rug out from underneath the market.
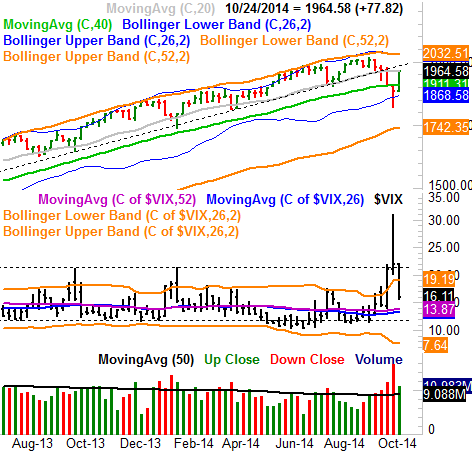
S&P 500 & VIX - Daily Chart
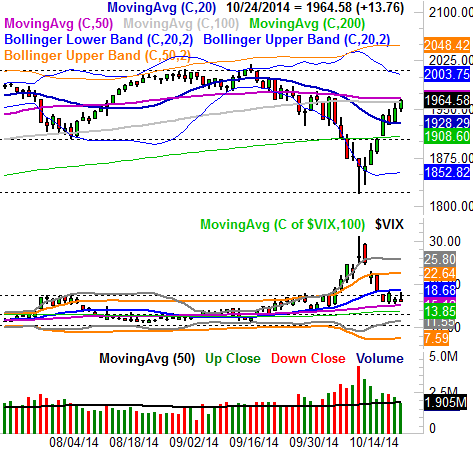
All charts created with TradeStation
What's interesting - and not in a bullish way - is how the CBOE Volatility Index (VIX) (VXX) has seemed unwilling to try and move below a swath of support between 13.0 and 18.0. It may be a tacit sign that the bulls have done all they're going to do for now.
On the off chance the S&P 500 does manage to punch past its pivotal ceiling 1965 this week, that may be good for a break all the way to somewhere between 2003 and 2010, where it will meet another technical ceiling. The end of the stock rally, however, may be better marked by the VIX's encounter with one of its other floors. The lower 20-day Bollinger band (gray) at 11.55 seems like the most realistic stopping point.
Again though, an immediate bullish follow-through from the market from here is the less likely outcome. More realistically, a modest pullback to the 1908-ish area where the 200-day moving average line (green) is would make the most sense as a floor now... although the 20-day moving average line at 1928 has to be considered a potential floor as well. Once we start to see hints of the bulls testing the waters again if one of those floors has been met, it's probably a good time to start trickling back in.
It doesn't add much to the discussion, but a look at the weekly chart of the S&P 500 will put things in perspective about just how deep the cut from two (and three) weeks ago was, and how much of that wound has already healed. There's still room to keep recovering too, and the broader trend is still a bullish one. It's in this timeframe we can see just how crucial the 200-day moving average line (green) is at this point.
S&P 500 & VIX - Weekly Chart
With all of that being said about the charts, momentum and upside resistance, let's take a look at the broad market (DIA) (IWM) (QQQ) valuations.
As of right now, assuming the Q3 earnings projections will be met, the S&P 500 is valued at a trailing P/E of 17.1 and a forward-looking one of 15.1. That does leave some room for gains, but both P/E measures are at the upper end of their normal ranges. At 2032, which is a major ceiling for the S&P 500 on the weekly chart, the trailing P/E reaches 17.7 and the forward-looking P/E becomes 15.6.... beyond what's been tolerable most of the time.
It's just something to keep in mind no matter when the market manages to break through its current ceilings - we're dealing with a potential valuation headwind that can be a problem going forward.
Trade Well,
Price Headley
BigTrends.com
1-800-244-8736