NASDAQ Concerns - Market Outlook
Monday's loss may not have been a big one, but it certainly wasn't an encouraging step in the right direction following last week's dip, with a Fed meeting still on tap this week. Yet, it's not like the market has fallen over the edge of a cliff - there's still a way the bulls could figure a way around an overdue and much-needed pullback.
We'll look at those opportunities in a moment. First we need to paint with the broad brush strokes of economic information.
Economic Data
While there was a steady flow of economic data all last week, not much of it was market-moving. The only item of any real interest was August's retail sales growth, which were good... as expected. Overall retail sales were up 0.6% for the month (from July's levels), and retail sales not counting automobiles was up 0.3% between July and August. On a year-over-year basis, retail consumption was
Retail Sales, YOY Chart
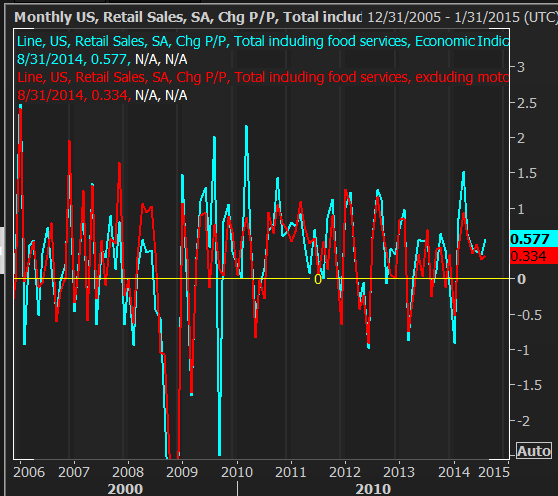
Source: Thomson Reuters Eikon
This week is already a little busier than last week too, in terms of economic numbers. It's going to be harder hitting stuff too, beginning with last month's industrial production and capacity utilization being unveiled on Monday. The data fell on for both. Capacity utilization fell from 79.2% to 78.8%, while industrial production fell 0.1%. Any step backwards is a step in the wrong direction, but this information is hardly cause for alarm just yet. The bigger trends in both cases are still pointed upward, and this is definitely long-term data.
Industrial Production and Capacity Utilization Chart
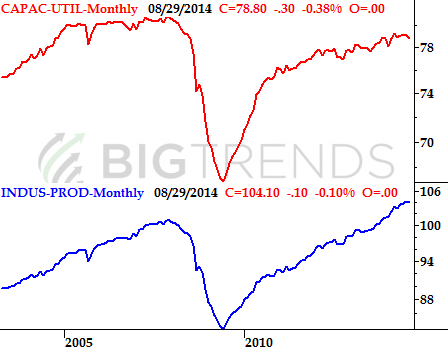
Source: U.S. Federal Reserve
Economic Calendar
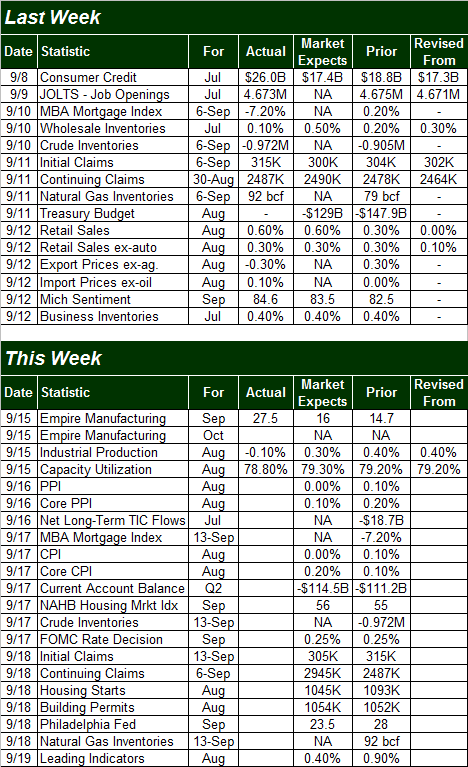
Source: Briefing.com
There's still plenty in store for the week though, like a big dose of inflation data. We'll hear last month's producer price inflation rates on Tuesday, and on Wednesday we'll get the consumer inflation data for August. A month ago both figures suggested inflation was pretty well tamed, and the improvement in the value of the U.S. dollar has only kept inflation at bay. As of July, the consumer inflation rate was 2.0%, and the producer inflation rate was 1.7%. It's unlikely either was up for August.
Inflation Trends Chart
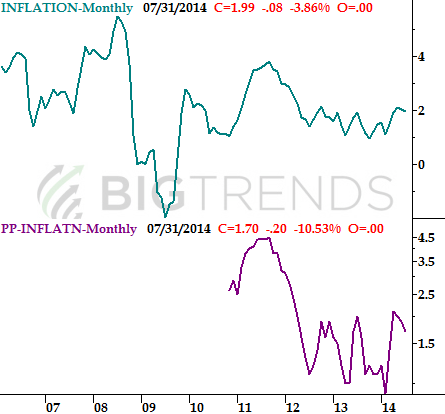
Source: Bureau of Economic Analysis/Department of Labor
We're also starting a wave of housing and real estate data near the end of the week, with Thursday's housing starts and building permits figures for August. The expectations are basically for figures comparable to July's. However they come out, the overall undertow is a positive one.
Real Estate and Construction Trends Chart
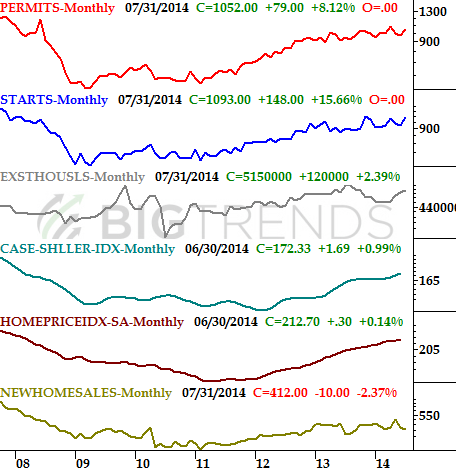
Source: Census Bureau, National Association of Realtors, and FHFA
Stock Market Index Analysis
Let's start with Monday's most alarming red flag... the NASDAQ Composite's (COMP) (QQQ) breakdown below 4539. Through last week, that floor had held up. On Monday though, it failed, allowing the NASDAQ to move under a key support level. That pullback to a close of 4518.90 also pulled the composite under the 20-day moving average line for the first time in over a month, after it acted like it was going to find support there at the end of last week.
NASDAQ Composite & VXN - Daily Chart
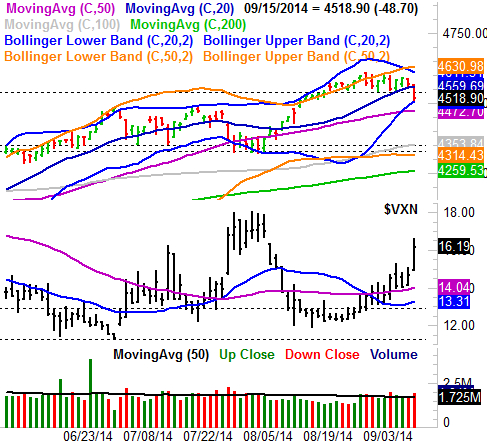
All charts created with TradeStation
There's still a glimmer of hope for the NASDAQ - the selling seems have stopped at the lower 20-day Bollinger band. It's not like the bulls have pushed up and off of the lower Bollinger band yet, however. It's still in prime position to break under it.
When we zoom out to a weekly chart, the NASDAQ still looks like it's in trouble. Ever since the composite broke under a major long-term support line (dashed) in April, it's been unable to get back in that bullish groove. In fact, the pace of the broad advance has clearly slowed ever since that April stumble. Being realistic, in this particular timeframe we can't really count on stocks finding a firm floor until the NASDAQ falls back to the 200-day moving average line (green), currently at 4278, but rising.
NASDAQ Comp & VXN - Weekly Chart
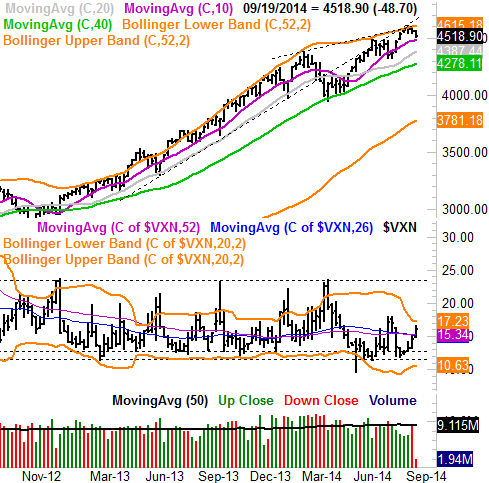
Throw in the fact that the Nasdaq Volatility Index (VXN) is still just starting to rise and hasn't even come close to bumping into its key ceiling around 23.50, and it's tough not to think we're possibly headed for a relatively significant correction.
Nothing really changes when we turn the focus on the S&P 500 (SPX) (SPY). The large cap index was already deteriorating via last week's move under a floor at 1986 and a move below the 20-day moving average line at 1994. Monday's lower low and lower close only pulled the index a little further away from a rebound. You can also see the CBOE Volatility Index (VIX) (VXX) is in a firm uptrend here, even if the S&P 500's pullback isn't yet quite as firm.
S&P 500 & VIX - Daily Chart
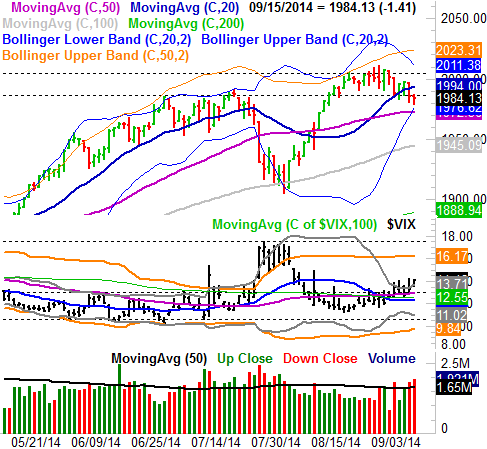
Taking a step back and looking at a weekly chart of the S&P 500, however, tells us that while a pullback may still be in the cards, there's a decent chance the dip here could be well contained.
Looking closely at the chart, you'll see the index has frequently found a floor at straight-line support (dashed) going all the way back to late-2012. It's also found support at the 100-day moving average line (gray) since early 2013. Care to guess which two lines have converged at 1954? Yes, the long-term support line AND the 100-day average line. We have to assume the bulls will at least make a pretty good stand there, if pressed.
S&P 500 & VIX - Weekly Chart
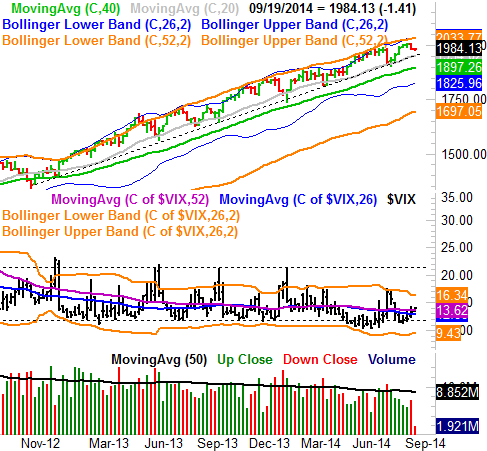
It's also in this weekly timeframe we can see the VIX hasn't even come close to a toppy level, though it is on the move.
So what's the call here? From a technical perspective, the scales tip in favor of bearishness, but just barely. And, regardless of what gain or loss the market makes over the next month or so, choppiness is almost sure to be in the menu. Don't get lured in too much on any bullish pops. September and early October are generally weak periods for stocks, and the August rally has set up a near-perfect calendar-based lull. Although we won't get there in a straight line, we are looking for the NASDAQ to test its 200-day line now that the bears have some momentum. If you want to know precisely where the bottom is though, odds are good the VXN and the VIX will mark them better than the indices for themselves. Look for the volatility indices to retest bigger-picture ceilings as clues that a bottom has been hit.
Trade Well,
Price Headley
BigTrends.com
1-800-244-8736