Key SPX & VIX Levels To Watch Here - Weekly Market Outlook
Key SPX & VIX Levels To Watch Here - Weekly Market Outlook
Even with last week's losses, there's a glimmer of hope for this overbought market. And with the onset of earnings season, anything is still possible. Just know that the deck is still stacked against stocks here. They reminded everyone last week that no rally can last forever. The good news is, there are some clear lines in the sand we can use to spot the eventual market pullback that's on the horizon.
We'll discuss those milestones on a moment. The first items we need to cross off our to-do list are this week's economic announcements.
Earnings Calendar
It's that time of year again. While earnings season officially started last week, it's this week we start getting several key earnings announcements every day... enough to really move the market. Just to help you keep track, here's a calendar of the major ones in the queue for this week.
Earnings Calendar
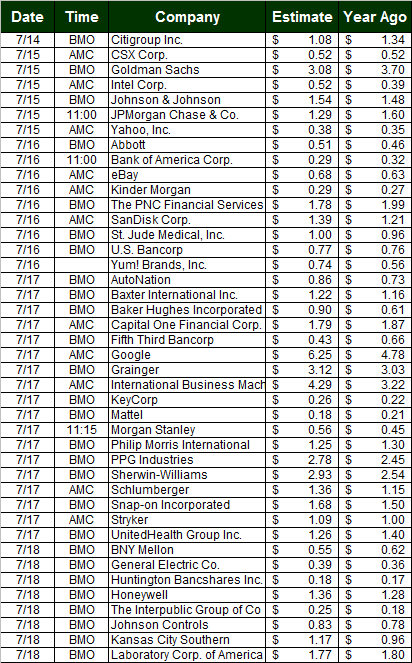
Source: Briefing.com
Economic Analysis
We mentioned a week ago that last week's economic data dance card was oddly empty, and it's not as if those low expectations were exceeded. Indeed, there wasn't even one single data nugget worth charting from last week. Take a look.
Economic Calendar
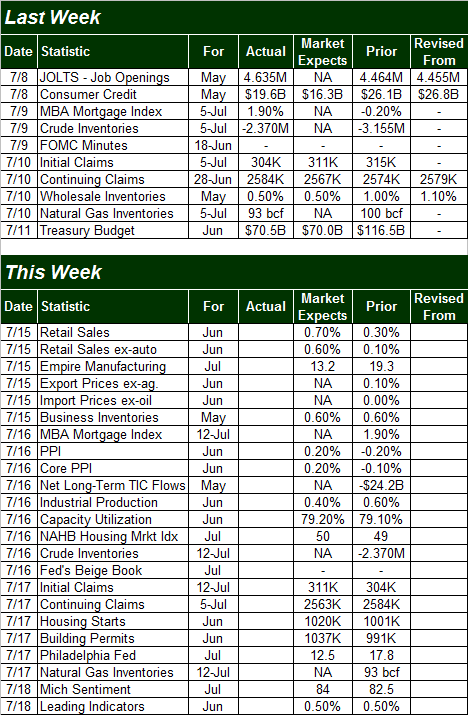
Source: Briefing.com
This week's economic data calendar is considerably fuller, as you can see. In fact, some of it is so important we actually want to go ahead and show you the charts through last month's figures, just so you have some context heading into the official unveilings. In order of appearance...
The party starts on Tuesday with June's retail sales. As you can see on the chart, year-over-year retail spending is still positive, but the pace of growth since 2011 is gradually subsiding. The pros are expecting a very strong retail spending surge for June, with or without automobiles.
Retail Spending Trends Chart
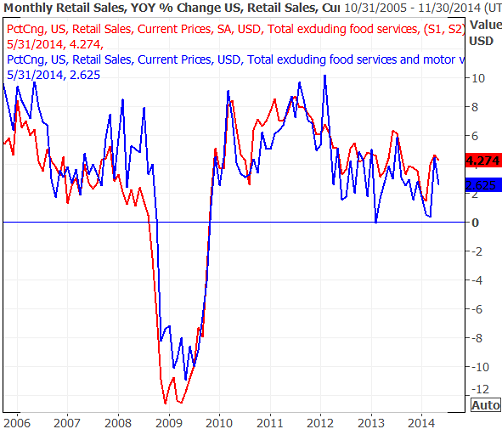
Source: Thomson Reuters Eikon
On Wednesday we'll hear about last month's producer price inflation rate. Two months ago it looked like it might surge, but that rally was somewhat capped before it got going last month. Things should remain tame this time around too. Whatever the number is, it won't be the important inflation figure for investors. That number won't be published until next week when we get June's consumer inflation rate (which is a little scarier).
Inflation Trends Chart
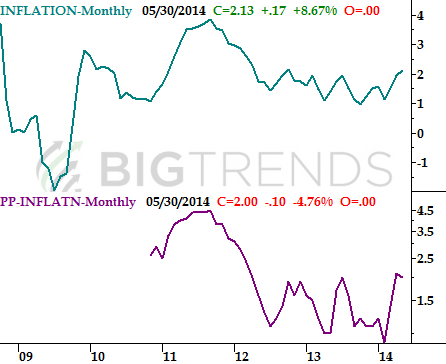
Source: Bureau of Labor Statistics
This week's most important data will likely be underappreciated... capacity utilization and industrial productivity. Economists are looking for progress on both fronts for June when released on Wednesday, extending their tepid uptrends.
Capacity Utilization and Industrial Productivity Chart
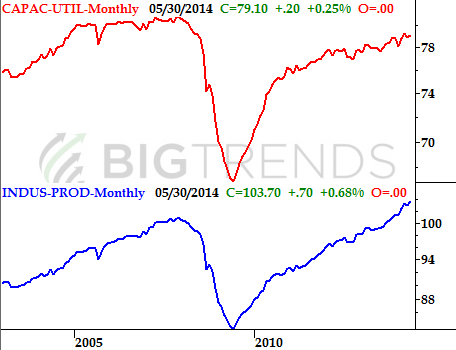
Source: Federal Reserve
Finally, we kick off a string of real estate and construction data on Thursday, beginning with last month's housing starts and building permits. The pros are telling is to look for a little progress here for June, though most longer-term real estate trends have waned in recent months.
Real Estate & Construction Trends Chart
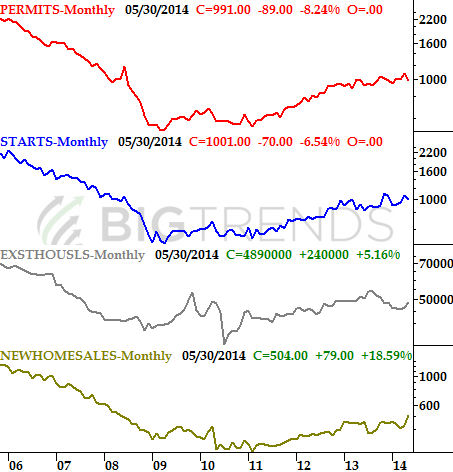
Source: Census Bureau, Bureau of Labor Statistics, and National Assn. of Realtors
We're going to see dozens of Q2 earnings reports this week too, so odds are good much of this data could be obscured by earnings news. It might be worth making a point of tracking down the economic data as it's released, since it still can be what moves the long-term market.
Stock Market Index Analysis
The S&P 500 (SPX) (SPY) may have lost 17.87 points (-0.9%) last week. Yet, the uptrend is still technically intact. Specifically, although this overbought index lost ground last week, the key 20-day moving average line at 1961.28 is still acting as a floor. It's not difficult to see how all it took was a brush of the 20-day moving average line on Thursday as well as Friday of last week to spark some renewed bullish interest. Until this key short-term average line breaks down as a floor, the uptrend will still technically be in place. The pressure is building though.
S&P 500 & VIX - Daily Chart
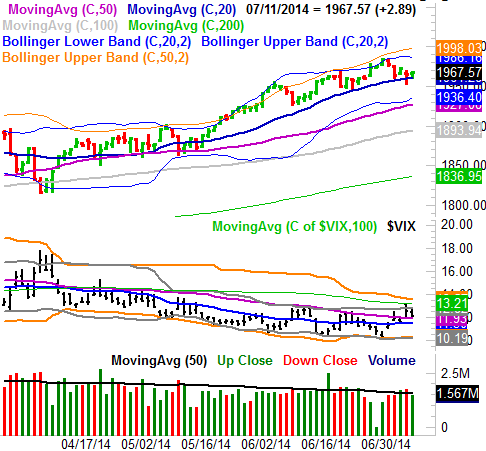
All charts created with TradeStation
At the same time, the CBOE Volatility Index (VIX) (VXX) is putting some serious pressure of its own on its upper limits. Specifically, the VIX is facing a key technical hurdle at 13.0 (dashed). A move above the 13.0 level, in fact, would represent something of a paradigm shift for the VIX. Above 13.0, there's not much else that could stop a surge.
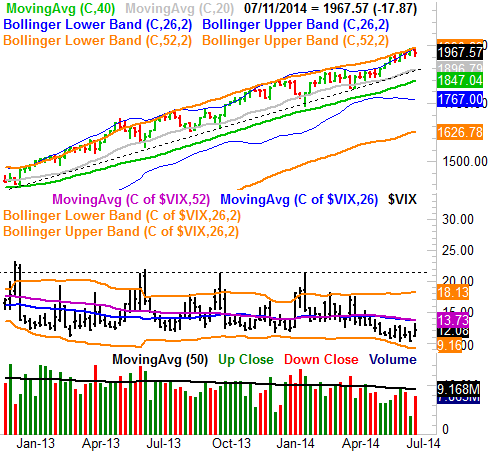
We don't see anything new when we zoom out to a weekly chart of the S&P 500, but the weekly view does better illustrate how overbought the S&P 500 is. The upper 52-week Bollinger band is a major ceiling in this timeframe, and after a few weeks of bumping into the upper band, the bulls are getting weary.
S&P 500 & VIX - Weekly Chart
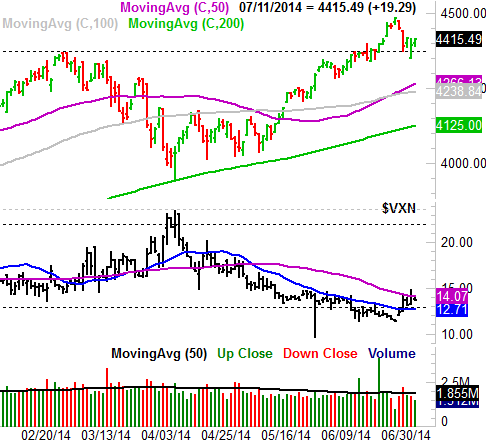
A look at the NASDAQ Composite (COMP) (QQQ) adds a little color to the situation. It's interesting that the former ceiling at 4373 (dashed) may have become a floor. In fact, so far it has been a floor, in conjunction with the Nasdaq Volatility Index's (VXN) ceiling at the 50-day moving average line (purple, currently at 14.07). There's pressure being put on both, however. As was the case with the S&P 500 and the VIX, one stumble from the NASDAQ and/or one good thrust from the VXN could change things for the worst in an instant. Until then though, we have to give the benefit of the doubt to the bulls.
NASDAQ Composite & VXN - Daily Chart
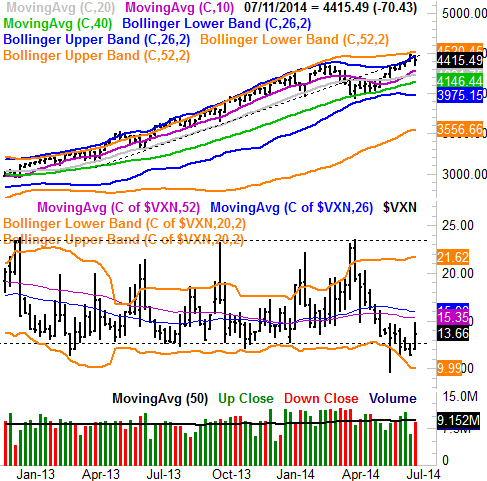
The NASDAQ Composite is clearly back in an uptrend in the weekly timeframe, bit it's a fragile one. And, in the weekly timeframe we can see how oddly low the VXN is here.
NASDAQ & VXN - Weekly Chart
The bottom line is, we're close to a possible meltdown, but not in meltdown mode yet. Until that happens, we have to assume the bulls are still in control and forging ahead... even knowing the uptrend can only last a tad longer, at best. In other words, right now the market is like the ocean - you don't want to turn your back on it. We're at a pivot point.
Trade Well,
Price Headley
BigTrends.com
1-800-244-8736