High Volume Selloffs - Weekly Market Outlook
High Volume Selloffs - Weekly Market Outlook
The good news is, the bulls halted the pullback started two weeks ago. The bad news is, once we hit record highs on Friday, the bears pulled the rug out from underneath the rally. Although all the major indices ended last week with a gain, they also ended last week pointed in the wrong direction.
Yes, once again stocks are caught between a rock and a hard place, and traders aren't sure what they want to do. There are plenty of pending clues that will tell us the market's true nature, however. We'll explore the bullish and the bearish arguments in a moment, right after exploring last week's major economic data.
Economic Calendar
Though we heard a lot of economic numbers last week, truth be told, not a lot of it meant much for the market.
One of the more important sets of updates we got was on the real estate front... housing starts, building permits, and existing home sales. Between the three, we got something of a mixed message. Housing starts were basically flat, falling from a rate of 909K to 907K, while building permits grew from 945K to 1018K for February. As for existing house sales, February's pace of 4.6 million was just a tad slower than January's pace of 4.62 million.
The data we need to fully update the chart of real estate and construction activity below will be posted next week, but even without that data we can see that the real estate market remains merely mediocre.
Real Estate & Construction Trends Chart
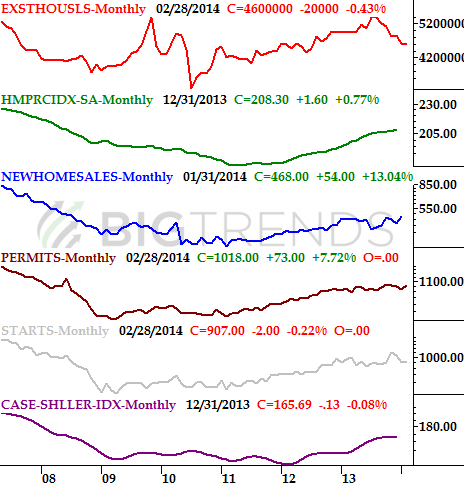
Source: U.S. Census Bureau and the National Association of Realtors
The only other data we got last week that was of any real consequence was the Fed's capacity utilization and industrial productivity measure, for February. These number were a little more encouraging than the real estate numbers were, though, at least for long-term investors who are truly only holding stocks based on the ongoing cyclical economic expansion. The nation is now using 78.8% of its ability to produce manufactured goods, up from January's 78.5%, while February's industrial productivity grew by 0.6%; the industrial productivity index reached 106.6... the highest level it's ever been.
Capacity Utilization and Industrial Productivity Chart
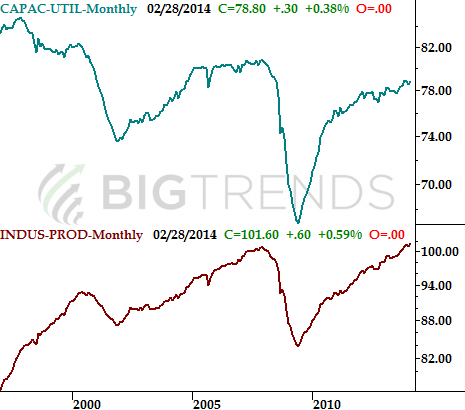
Source: U.S. Federal Reverse, at www.federalreserve.gov.
While it may have little impact on the market's near-terms ebbs and flows, the economy's (and long-term market's) underpinnings remain relatively healthy.
Everything else is on the calendar below:
Economic Calendar
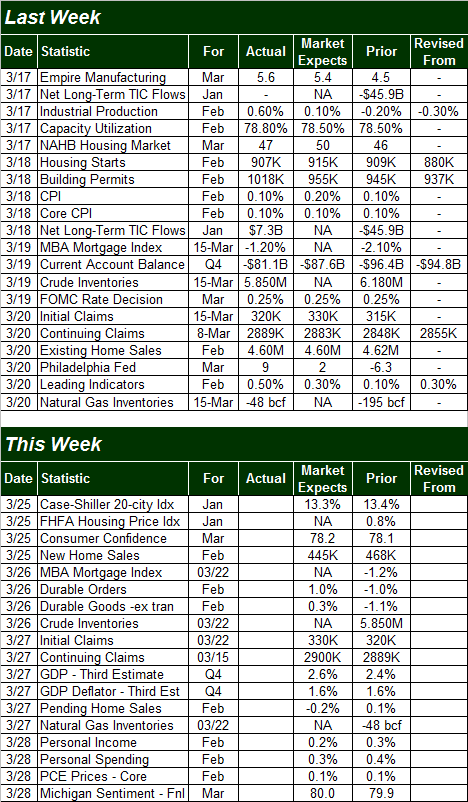
Source: Briefing.com
This week is going to be equally busy, with a big chunk of this week's economic data rounding out the real estate picture. Specifically, we'll hear January's Case-Shiller Index data on Tuesday, along with February's new home sales. Prices should be up, though sales are expected to be down, underscoring the mixed message we've been getting on the real estate scoreboard of late.
The other big number we'll be getting this week is February's durable orders data, on Wednesday. The pros expect a reversal of January's dip, looking for a 1.0$ increase overall, and a 0.3% improvement when removing transportation orders from the equation.
Thursday's third (and final) estimate of Q4's GDP isn't likely to sway the market much, unless the number we get is way off from the second guess of 2.4% or the latest expectation of 2.6% growth.
Stock Market Index Analysis
The fact that the S&P 500 (SPX) (SPY) just barely clipped a new high on Friday and then immediately retreated should come as no real surprise. Friday's high of 1887.97 was almost perfectly aligned with the early-March peak of 1883.57. There was a ceiling right around there a couple of weeks ago, so why wouldn't there still be one there now? Making that resistance even stronger is the fact that the S&P 500's upper 20-day Bollinger band is right there as well... again.
S&P 500 & VIX - Daily Chart
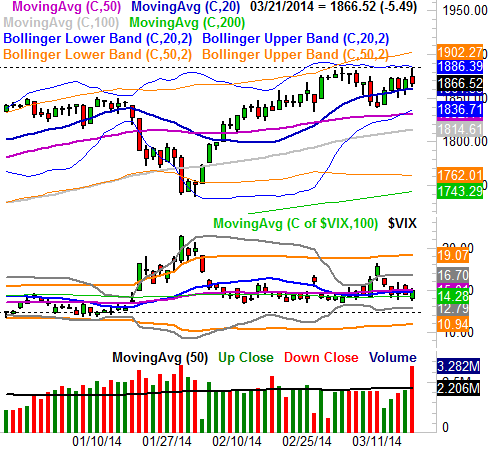
All charts created using Omega Research TradeStation 2000i.
The million-dollar question is, of course, is whether or not Friday's intraday reversal was the beginning of a more serious pullback. While it's too soon to say with any real certainty, the odds do seem to point in a bearish direction at this time, for a fairly easy-to-miss reason.
While Friday's intraday reversal is telling, what's most bearish about isn't the reversal itself, but the spike in volume that went along with it. There were a lot of people getting in early on Friday, and a lot of people getting out later in the session. This may represent the proverbial changing of the guard - the point where the number of sellers is finally greater than the number of buyers.
More important, previous volume spikes like this one have proven to be key pivot points (bearish as well as bullish) in recent history. For instance, the spike in volume from June of 2013 marked a key turning point for the S&P 500.
S&P 500's Reversal from June of 2013 Chart
Point being, we've seen this clue before, and it tends to mark the end of relatively meaningful, and the beginning of equal and opposite trends.
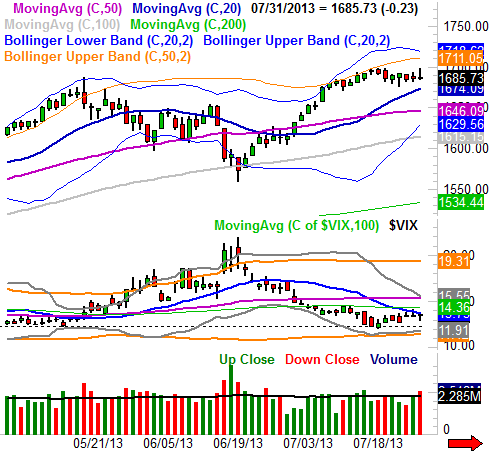
So, just for the sake of argument, let's say the bears are going to follow-through on the hint they dropped on Friday. Where might the S&P 500 find a bottom? It's not so much where the index is most likely to find a floor, but where the CBOE Volatility Index (VIX) (VXX) finds a ceiling. As the weekly chart of the S&P 500 and the VIX below shows, the market's major bottoms have only been found of late when the VIX brushes the ceiling at 21.4. We can see the VIX is broadly moving upward, but it's gotten nowhere close to the peak in fear in weeks.
S&P 500 & VIX - Weekly Chart
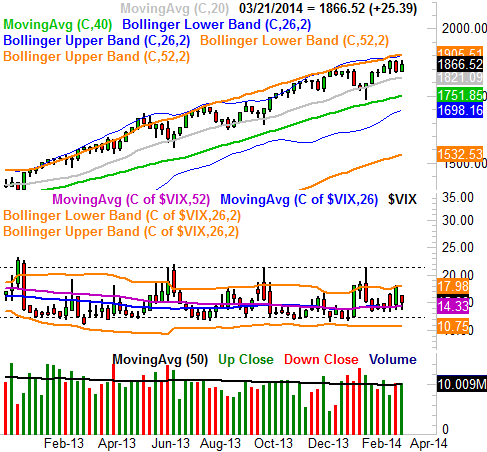
With all that being said, what the market is most likely to do and what it will do continue to be two differing things. The fact of the matter is, while we're arguably due for a fairly significant pullback, it looks like the 20-day moving average line at 1861.5 is still acting as support, and even if the 20-day line should fail as a floor, there's a bunch technical support around 1836 where the 50-day moving average line currently rests. Unless both of those support areas are breached, any downside this week us just a little more volatility. If 1836 does break down as support, however, look out below.
Conversely, should the S&P 500 take the lower-odds path and punch through the ceiling at 1884, then the game completely changes as the odds then favor a new wave of buyers piling in, spurred by the excitement of new highs.
Almost needless to say, this week is going to be a very pivotal week. And an interesting, churning market in 2014 continues.
Trade Well,
Price Headley
BigTrends.com
1-800-244-8736