Have The Bears Wrestled Control Of January? - Weekly Market Outlook
Have The Bears Wrestled Control Of January? - Weekly Market Outlook
While there was only one particularly bad day last week, one bad day was enough. The market's close on Friday was a half-percent lower than the prior Friday's close, getting stocks started on the wrong foot for 2014. And, the near-term bottom may not have yet been found -- but how things get started this week will be critical to how things finish for the month.
We'll look at the details of which direction stocks are headed right now in moment. First - and as always - let's first run down last week's big economic numbers and take a look at the economic data in the lineup for this week.
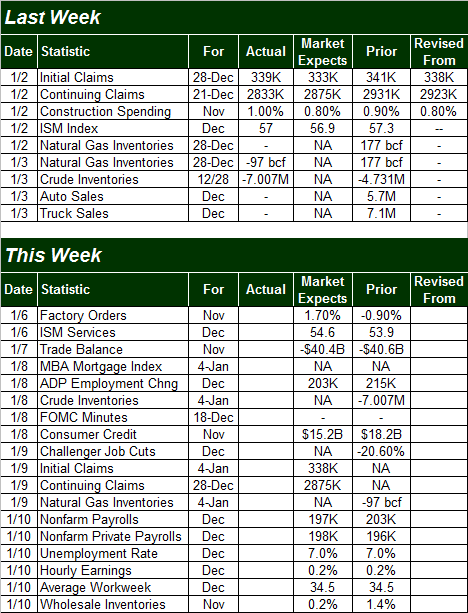
Economic Calendar
Truth be told, between the holiday and the fact that last week was the tail end of one month and the earliest part of another, there wasn't much in the way of economic news last week. The only news of any real consequence was a month old... November's construction spending. It was up 1.0%, which isn't an especially hot or cold figure.
The initial unemployment claims figure (for the week ending in December 28th) was a ho-hum 339,000, versus an expected 333,000, and down from 341,000. By and large though, that number's been pretty stagnant for a while. Ditto for continuing claims. That figure fell from 2.931 million three weeks ago to a level of 2.833 million two weeks ago, a tad under the expected $2.87 million. Yes, it's a little lower, but like the new claims figure, the ongoing unemployment claims for the most part is stuck at its current level.
The coming week will be busier, and we'll get a much more meaningful look at the unemployment picture. Specifically, we'll hear December's unemployment rate and payroll growth on Friday. Economists say the unemployment rate should hold steady at 7.0%, and that 185,000 new jobs will be created. [That 185,000 new jobs the pros are expecting is for the official government figure as well for the ADP employment change figure, which will be announced on Wednesday.. one of the closest matches we've seen between the two separate numbers in a while.]
The only other economic data cued up for this week that's worth noting will be unveiled on Monday - November's factory orders. Forecasters say they should be up to the tune of 1.7%, which would be a nice turnaround from October's 0.9% dip. It's not a particularly well-followed piece of data, however, so it's not apt to move the market much unless we see a wide variance from the forecast. Odds are most traders will have their mind on other things on Monday, like whether or not the stock market is going get things going in a bullish direction this month before it's too late... before anxious traders throw in the towel and start selling in earnest.
Economic Calendar
Stock Market Index Analysis
Above all else, know that this time of year (the end of two major holidays and the beginning of a new calendar month as well as a new calendar year) can really skew things for stocks, so take everything you're about to read - and everything you've seen of late - with a grain of salt. The market is more than capable of stopping and turning on a dime several times in its current state, and woe to those who don't respect that reality. With that being said...
As of right now, or as of Friday's close anyway, the bears are in control. That's not to say we're at the onset of a monster-sized correction. It's not even to say the market's going to be in the red come Monday morning. It's just to say that as of what we know and can see right now, the momentum is bearish.
It doesn't take a lot of work or thought to see how things got that way. After reaching into record-high territory as we approached the end of last year, the weight of those gains began taking a toll, as they did in early December, and as they did in late September. Take a look.
S&P 500 & VIX - Daily Chart
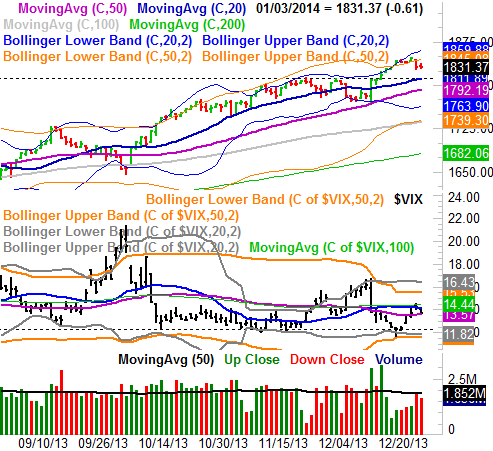
As you can also see, the S&P 500 (SPX) (SPY) has yet to brush any major support levels. The biggest one in view right now is 1812.0. That was a big ceiling in November and part of December, and it's also where the 20-day moving average line is at this point. Both could turn into a floor pretty easily. Even if the 1812 doesn't bring and end to the selling effort though, the 50-day moving average line (purple) could do the same. In fact, you only have to go back to mid-December to see the 50-day moving average's ability to spur a rebound. The CBOE Volatility Index (VIX) (VXX) is at a mildly elevated area above 14, around the middle of its Bollinger Bands.
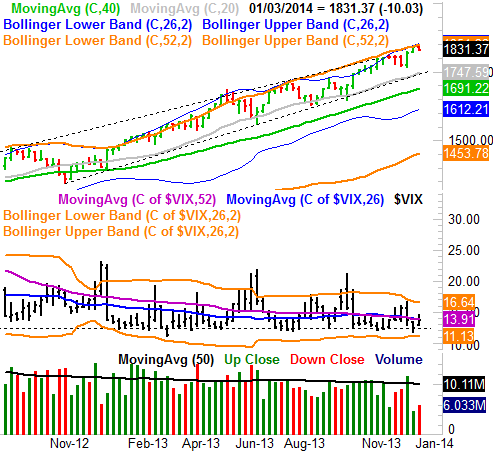
A refreshed look at the weekly chart below underscores the reality that the market is overbought. On the flipside, it's also on the weekly chart we can see the S&P 500 has been extremely well supported since late 2012. See the dashed line that's acted as the bottom edge of a long-term bullish channel? It's been proven as a support level a few times since 2012, and is currently at 1740... right where the 100-day moving average line (gray) as well as the lower 50-day Bollinger band are right now. As long as that line holds up as support, the bigger uptrend will remain intact.
SPX & VIX - Weekly Chart
Again though, it's anybody's guess as to what kind of mood traders are going to be in this week. It's entirely possible all the recent buyers that were interested through the end of calendar 2013 were just taking some time off at the end of last week, and will be back at it this week. If the S&P 500 can fight its way back above the 1845 mark, that's apt to spark another round of trade-worthy buying. Anything between 1812 and 1845 will just mean the market remains caught between a rock and a hard place, and isn't worth overly worrying about.
Trade Well,
Price Headley
BigTrends.com
1-800-244-8736