Avoid Overexuberance As September Begins - Weekly Market Outlook
Avoid Overexuberance As September Begins - Weekly Market Outlook
Although it was a low volume week, the bulls clearly outnumbered the bears last week. The S&P 500 (SPX) (SPY) managed to close at a record high close on Friday after hitting a record intraday-high on Thursday. Well supported or not, the momentum continues to carry us higher.
The advent of a new month against the backdrop of an overbought market, however, is a potential opportunity for the bears to take control again. And, from a statistical perspective, that potential is there for September. We'll take a look at the market's potential stumbling blocks after dissecting last week's and this week's economic numbers.
Economic Data
We got a fairly big batch of economic information last week. We'll stick with the highlights, beginning with Monday's and Tuesday's real estate data. On Monday we learned July's new home sales fell from a pace of 422,000 to 412,000. The overall uptrend is still in place, however. On Tuesday the Case-Shiller Index showed home prices were 8.5% higher in June than they were a year earlier, and the FHFA says home prices grew 0.4% between May and June.
Although the media raised a small red flag about the slump in new home sales, the worry wasn't merited. Looking at the whole real estate picture - last week's data too - the real estate and construction picture still looks like it's pointed in the right direction.
Real Estate Trends Chart
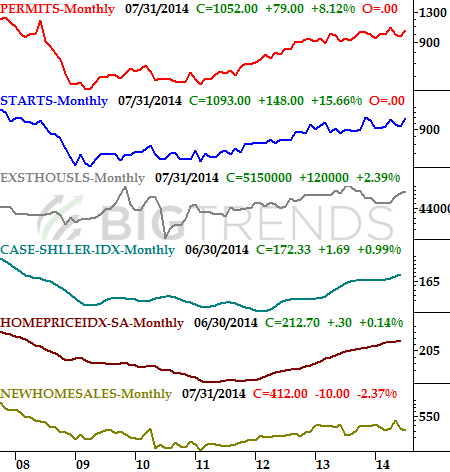
Source: Standard & Poor's, FHFA, National Association of Realtors, and Census Bureau
On Friday the media once again rattled investors' cages by obsessing about the fact that consumer spending slumped 0.1% in July. It was the first dip in a long time, and since all big trends start as small ones, this one could be the beginning of trouble. But, that's probably not going to be the case.
While consumers may have spent less in July, it's not because they're worried. The Conference Board's consumer confidence measure reached a multi-year high of 92.4 for last month. The Michigan Sentiment Index also rose to a multi-month high of 82.5 in August, and both data sets are in strong uptrends.
Consumer Sentiment Trends Chart
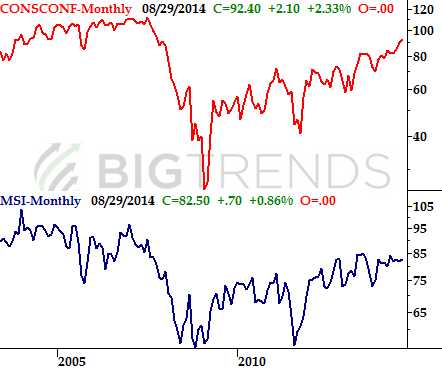
Source: The Conference Board and Thomson Reuters
And of course, we also got the second reading on second quarter's GDP growth. Rather than the first guess of 4.0%, it was actually up by 4.2%. The third/final reading will come in mid/late September, but isn't likely to change much from the second estimate.
Here's the rest on the following Calendar:
Economic Calendar
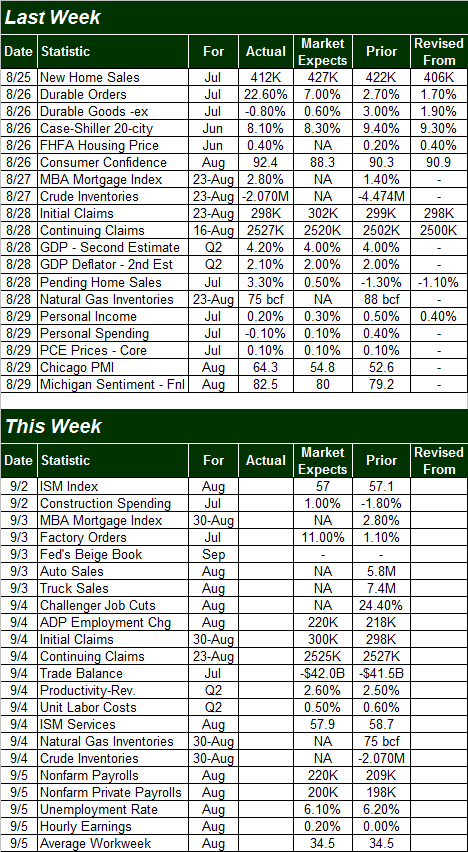
Source: Briefing.com
The coming week is pretty packed too, but the highlight for the week will be Friday's employment picture. The pros say we'll see more job growth (220,000 new jobs, to be specific), which should be enough to pull the unemployment rate down from 6.2% to 6.1%. Good or bad employment numbers could make or break, respectively, the market.
Stock Market Index Analysis
Based on nothing but momentum, it's tough to come to anything but a bullish conclusion after dissecting last week's market action. Both the NASDAQ Composite (COMP) (QQQ) and the S&P 500 closed at multi-year high closes on Friday, and for the S&P 500 it was a record high close. There's more to handicapping the market than momentum, however. There are a few red flags we can't overlook.
First things first. It was well fought, but when push came to shove at the end of the week last week, the S&P 500 closed above the 2000 level. It ended the week at 2003.37, but more important, it ended the week on a high note... reaching for higher highs. This could get things started on the right foot come Tuesday. The CBOE Volatility Index (VIX) (VXX) closed a little lower on Friday too, reversing what looked like a budding uptrend.
S&P 500 & VIX - Daily Chart
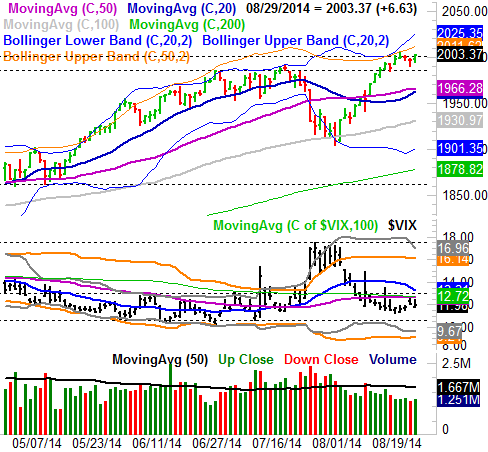
All charts created with TradeStation
The NASDAQ Composite is chugging along too. The close at 4580.27 was the highest close we've seen in years, and if you look closely at our chart below, you can see the composite has made a string of consecutively higher closes above the upper 50-day Bollinger band.
NASDAQ Composite & VXN - Daily Chart
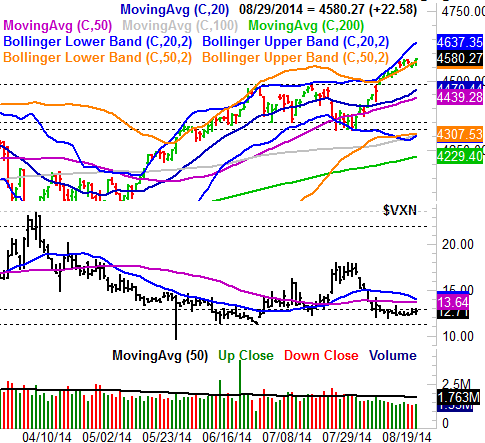
It's on this daily chart of the NASDAQ, however, where the red flags start to wave.
See the VXN? It's in a zone of support, between 11.30 and 12.90. Unlike the VIX, the VXN didn't edge lower on Friday. It looks like it's still trying to work its way higher again after hammering out a slow, U-shaped reversal over the past couple of weeks. It still hasn't popped back above the ceiling at 12.90, but unlike the VIX, it looks like the VXN is still trying to head higher.
There's yet-another red flag when we take a look at the Dow Jones Industrial Average (INDU) (DIA). It didn't close at record or multi-year highs on Friday. In fact, when it pressed the previous peak at 17,151 last week, the Dow peeled back and closed below that ceiling.
DJIA Daily Chart
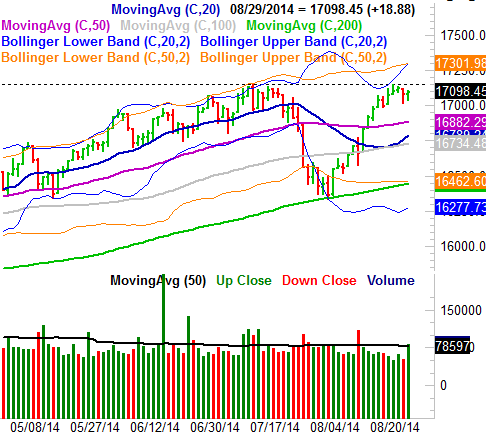
It's possible this leadership from the NASDAQ and then the S&P 500 and then the Dow Jones Industrial Average is a clue of a very aggressive mindset... a flight toward the more aggressive small caps and tech names in the composite and less interest in the safer havens of the blue chips that make up the Dow's components. In fact, that IS what this relative performance is indicating. The problem is, that attitude and optimism can stop and turn on a dime. And, if there was ever a time and opportunity for the bears to pull the rug out from underneath the market, September is it.
September is, on average, the worst month of all for the NASDAQ. It averages a 0.62% loss for the current month. The S&P 500's average loss for September is about the same, going all the way back to 1950. It's typically the worst month of the year for the large cap index too.
That alone doesn't mean this particular September is going to be a loser for the overall market. But, with the S&P currently priced at a frothy trailing P/E of 17.8 in addition to the fact that this is now the longest uninterrupted bull market in 85 years (it's 64 months old, though it's still not the biggest bull market ever as the late 90's still holds that title), the risks are too great to ignore. But that must wait until all the indices to break under key levels and make lower lows. Or perhaps more telling would be a break of the VIX and the VXN above their key ceilings. The VXN's is 13.6, and the VIX's is 12.7.
All that being said, bear in mind that even a loss in September could still just be a setup for what's likely to be the usual Q4 rally. The 20-day and 50-day moving average lines stand ready to halt any pullback attempt, if we need them.
Trade Well,
Price Headley
BigTrends.com
1-800-244-8736