Weekly Market Outlook - Weekly Charts Weakening
Weekly Market Outlook - April 25th, 2016
Though the S&P 500 (SPX) (SPY) managed to eke out a gain last week, it also ended the week fighting for its life, dropping hints that the rally is running out of gas. Meanwhile, the NASDAQ Composite (COMP) logged a weekly loss -- the second in the past three weeks -- and also hinted that a rollover was already taking shape.
Moving into the thick of earnings season could drive a course correction with little to no warning. Indeed, the course isn't even technically bearish yet. The bulls have a heck of a lot to prove now, however.
We'll hash out the details after running down last week's and this week's key economic numbers.
Economic Data
Last week wasn't a terribly busy week in terms of economic news, but it was a big week for real estate data... though not an especially encouraging week.
Perhaps first and foremost, we heard March's existing home sales tally last week.- existing home sales ticked a little higher, from 5.07 million to 5.33 million. It will be interesting to see if that growth is offset this coming week by a lull in the pace of new home sales (as has been the case in the recent past). We still contend that a modest lack of inventory may be slowing home sales down. Even so, we continue to see slow and steady progress on this front.
Home Sales, Inventory Chart
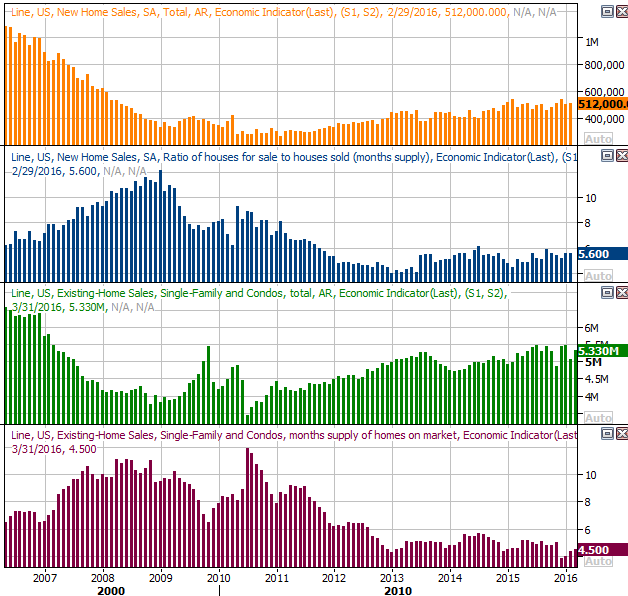
Source: Thomson Reuters
Don't sweat last week's lull in starts and permits too much, as March -- oddly enough -- is often a tepid one for both. On the other hand, both dips were more than slight, and neither data set was exactly rip-roaring heading into March's announcement. Another lackluster round of housing starts and building permits could be trouble.
Housing Starts and Building Permits Chart
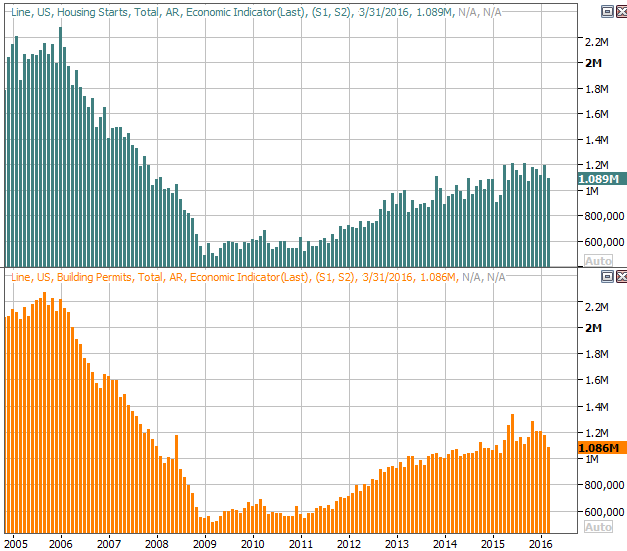
Source: Thomson Reuters
While total home sales and construction activity has waffled of late, one thing that's remained strong enough to serve as encouragement is pricing. Last week we heard the FHFA Housing Price Index, and this week we'll get the Case-Shiller Index for February. The former was up (again) last month, and the latter is still in a comparable uptrend.
Home Price Chart
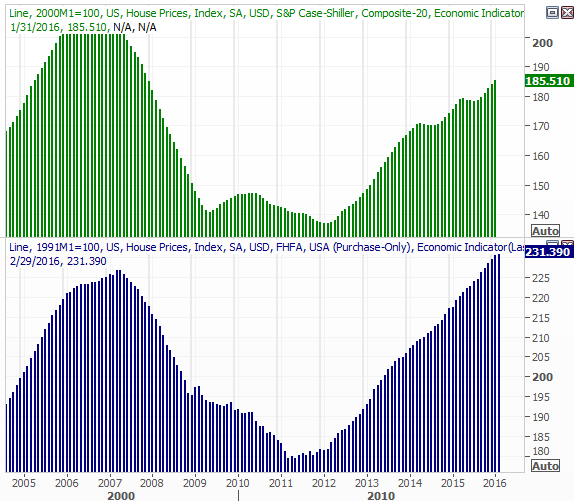
Source: Thomson Reuters
Everything else is on the following grid:
Economic Calendar
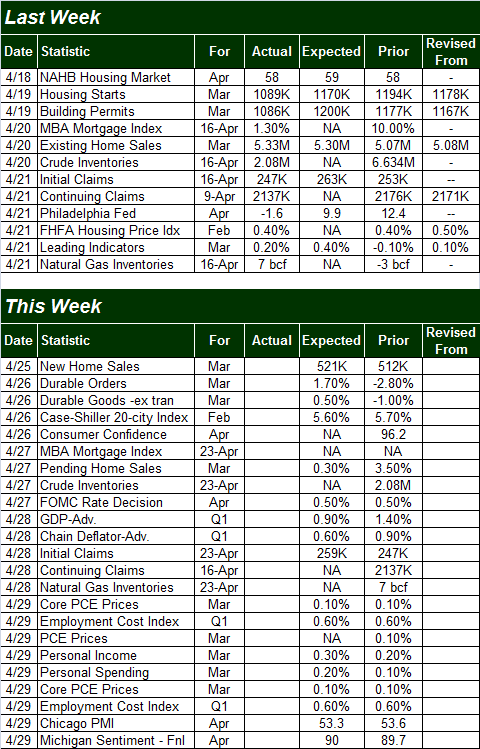
Source: Briefing.com
As was noted (and charted) above, this week we'll get the Case-Shiller Home Price Index and the new home sales report. That's not all we'll be getting worth watching out for, however. The biggie is Wednesday's decision from the Federal Reserve about an interest rate hike. Forecasters don't expect any change from the current Fed Funds rate of 0.5%, based on the collectively-tepid economic snapshot.
The only other item of significant interest is an updated look at sentiment. The Conference Board's consumer confidence score will be unveiled on Tuesday, and the final reading for the Michigan Sentiment Index will be posted on Friday; economists expect a reading of 89.8, down slightly from the second April reading of 90.0. Perhaps more noteworthy is the fact that sentiment has been slowly but persistently degrading since late-2014. Sooner or later, that weakening sentiment will matriculate as disinterested investors.
Consumer Sentiment Chart
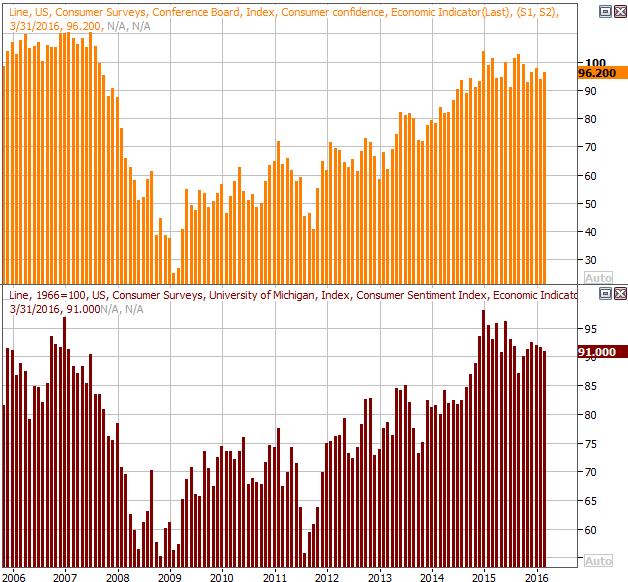
Source: Thomson Reuters
Stock Market Index Analysis
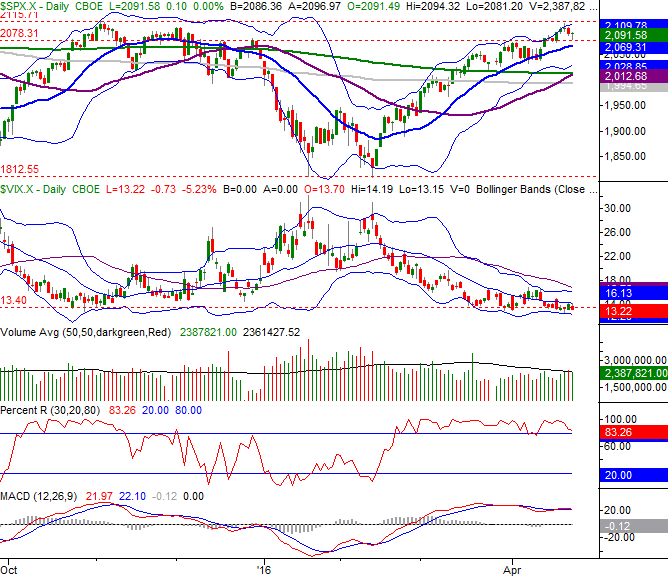
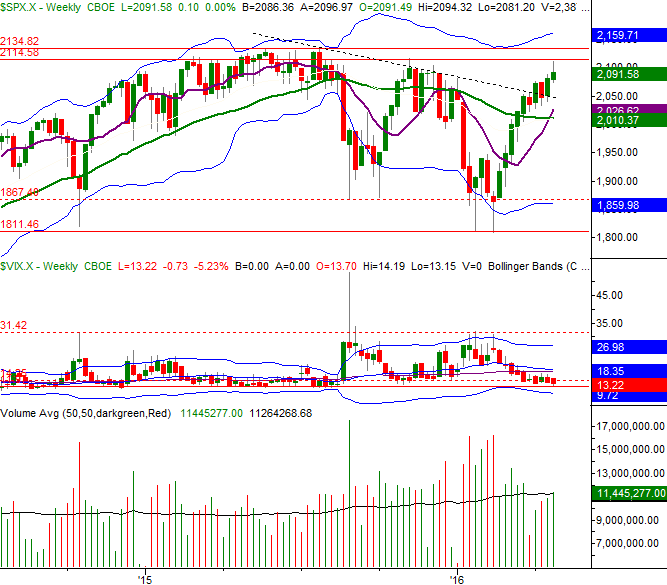
Let's start with the weekly chart of the S&P 500 first, just to paint the bigger picture before getting into the fine-tuned aspects of last week's net-gainful but alarming action.
As the chart below shows, yes, the index closed the week out with a small gain of 0.5%. As the chart also shows, though, last week's close was well off the high, leaving behind an upside-down hammer-shaped bar that often materializes at market peaks. Underscoring this possibility is the fact that last week's high of 2111.05 pretty much lined up with November's peak. You can also see the CBOE Volatility Index (VIX) (VXX) has struggled to move any lower over the course of the past few weeks. That's not surprising. The VIX has a firm floor at 12.1, and even just the mere approach of that floor can have a slowing effect; note that the S&P 500 struggles to move meaningfully higher when the VIX is as low as it is now.
S&P 500 & VIX Weekly Chart
 \
\
Chart created with TradeStation
The weekly chart of the NASDAQ Composite below looks rather similar, though is even more negative. The composite lost 0.6%, and logged what was something like a (bearish) inside-day reversal.
NASDAQ Composite & VXN Weekly Chart
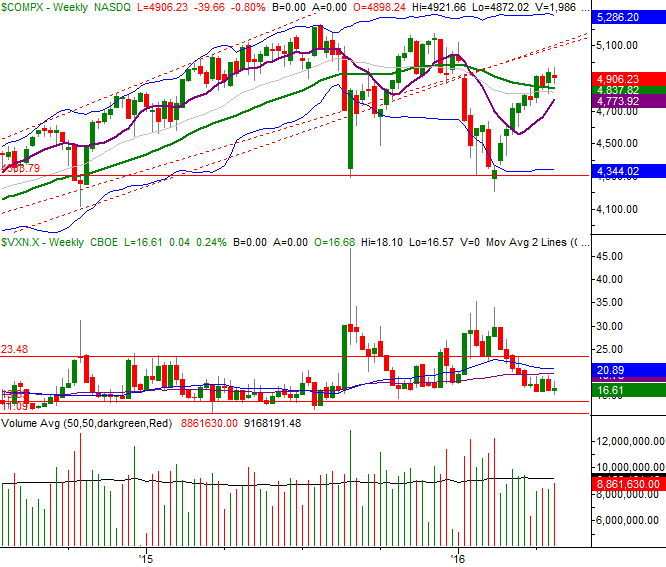
Chart created with TradeStation
While the weekly charts suggest the rally is running out of gas, the daily charts don't paint the same alarming picture.
The daily chart of the S&P 500 is still technically in an uptrend, and has yet to break under its 20-day moving average line even though it pulled back last week. The daily chart's Percent R line is also not only not in a confirmed downtrend yet, it's still above the 80 threshold that serves as a confirmed bullish clue. The MACD lines are mostly just flat, or non-directional.
S&P 500 & VIX Daily Chart
Chart created with TradeStation
The daily chart of the NASDAQ Composite has some common elements with the S&P 500... namely, the composite is still above the 20-day moving average line, after testing it on Friday. At the same time though, the NASDAQ dropped a couple of subtle bearish hints of late too.
One of those hints is the fact that the NASDAQ Composite didn't even come close to testing its November high the way the S&P 500 did. In a fully-bullish environment, the NASDAQ should be leading the charge, and performing more impressively.
NASDAQ Composite & VXN Daily Chart
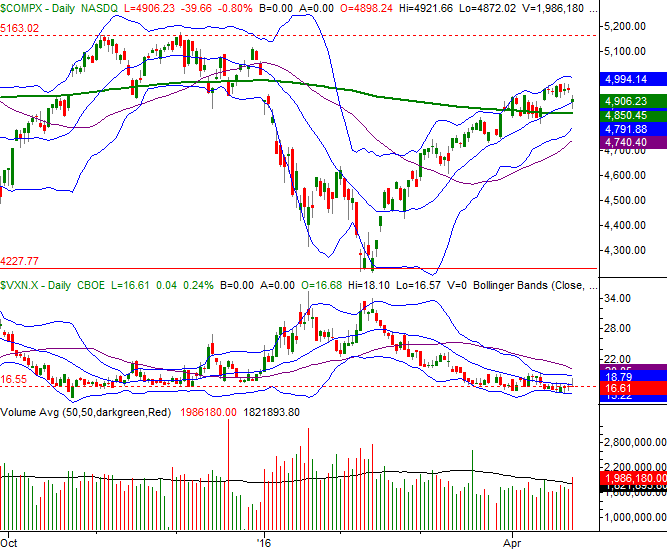
Chart created with TradeStation
The smart-money move right now may be to do nothing, and simply wait for the market to commit to one direction or the other. The BigTrends TrendScore for stocks ended the week at 85.7... still well into bullish territory, even if down for the week. Just be prepared for the worst. Should the S&P 500 fall below the 2012 area where several key lines are coming together, that could be interpreted as a bearish move beyond the point of no return.
Trade Well,
Price Headley
BigTrends.com
1-800-244-8736