Weekly Market Outlook - Valuation Concerns Creep In
Weekly Market Outlook - April 18, 2016
The market didn't end last week on a particularly bullish foot, but it doesn't matter - it started the week on such a bullish foot the S&P 500 (SPX) (SPY) was still up 1.6% for the week, and still above a fairy important resistance line. The strength still doesn't outright guarantee stocks will keep moving higher. In fact, even if stocks were in a great technical position to keep edging higher, we're once again running into a valuation headwind.
We'll dissect all of it below, right after a closer look at last week's and this week's most important economic news.
Economic Data
Last week was a big one for economic news, but three items stood out as game-changers. Inflation was one of the biggies, though perhaps it would be more accurate to call it a lack of inflation.
Producer prices (with or without food and energy costs) fell 0.1% for the month. Overall producer inflation is -0.1% on an annual basis, and core annual inflation peeled back to 1.0%.
As for consumer inflation, it was up 0.1% on a core and a non-core basis. Annualized, overall inflation stands at 0.85%, and core inflation is 2.2%. Producer as well as consumer inflation ebbed last month before moving beyond the Fed's tolerable levels, buying Janet Yellen a little time before the next rate hike became an outright requirement.
Inflation Chart
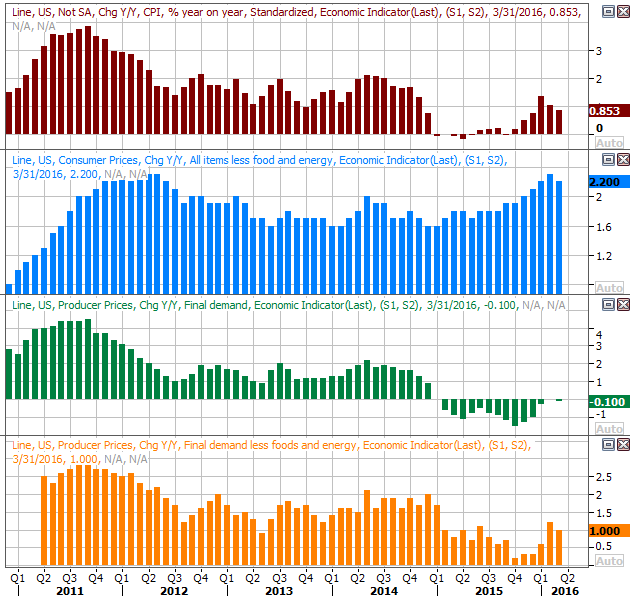
Source: Thomson Reuters
Retail sales, though, were solid. Overall they fell 0.3%, but on an ex-auto basis they actually grew 0.2% for the month. More important, regardless of the stratification in question -- with the exception of gasoline stations -- March-2016's retail spending was stronger than March-2015's tallies, and gasoline station sales only fell because gas prices remain subdued. This isn't the sore spot it superficially seemed to be this past week.
Retail Sales Chart
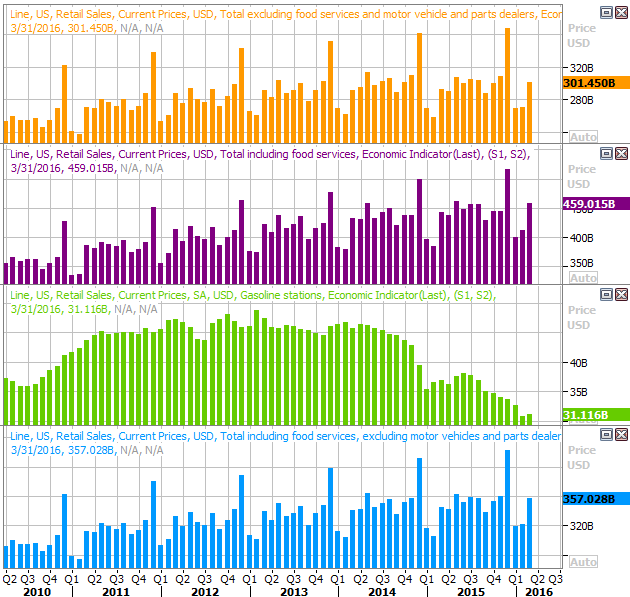
Source: Thomson Reuters
Finally, industrial production and capacity utilization fell. Were it the first or eve second lull from both data sets, it might not be a concern. Both are clearly in long-term downtrends though, and with no end in sight, this is something that's eventually going to take a toll.
Industrial Productivity and Capacity Utilization Chart
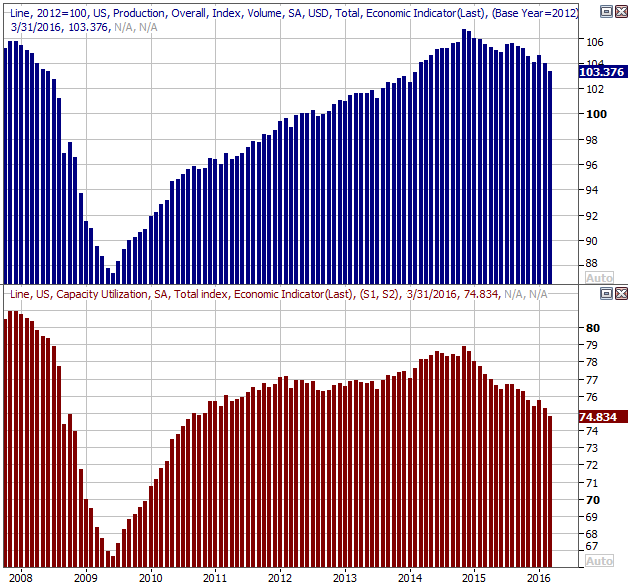
Source: Thomson Reuters
The bulk of this weakness in capacity usage and productivity stems from the meltdown of the energy sector (XLE), but the ripple effect may be starting to take hold. Something will have to change soon to sidestep a broad economic lull.
Everything else is on the following grid:
Economic Calendar
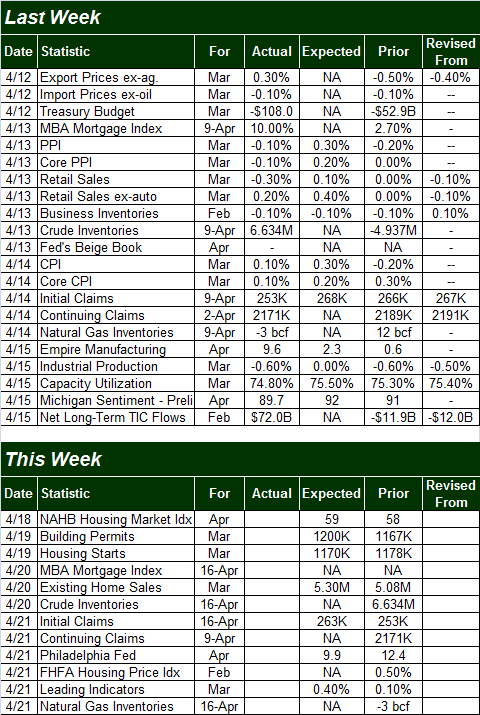
Source: Briefing.com
This week isn't going to be as busy, but it will be a big week for real estate. We'll hear last month's building permits and housing starts data on Tuesday, and March's existing home sales data on Wednesday. We'll also get a couple glimpses of home price trends.
On the starts/permits front, both remain in uptrends, though both also seem to be hitting some short-term turbulence. Higher readings from both this time around would be especially reassuring.
Housing Starts and Building Permits Chart
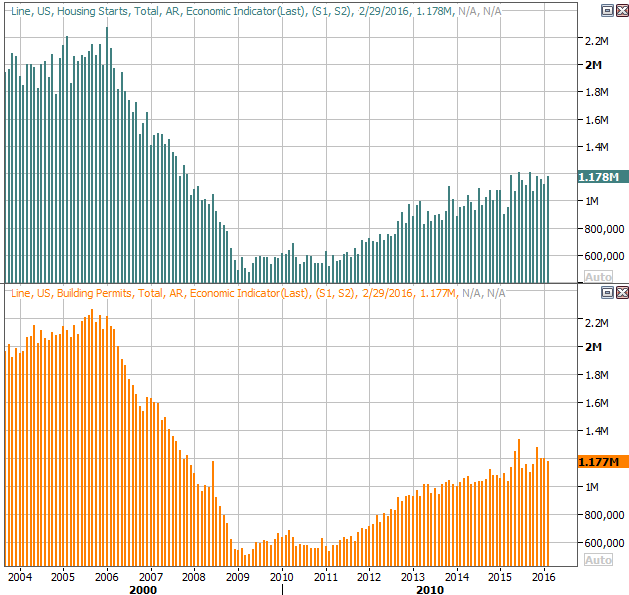
Source: Thomson Reuters
Ditto for home sales. That is, the bigger undertow remains pointed upward, though we've seen some alarming volatility for both of late. We'll get March's existing home sales this week, though new home sales won't be released until next week. Either way, note that a lack of inventory may be holding the numbers back as much as a lack of demand.
Home Sales Chart
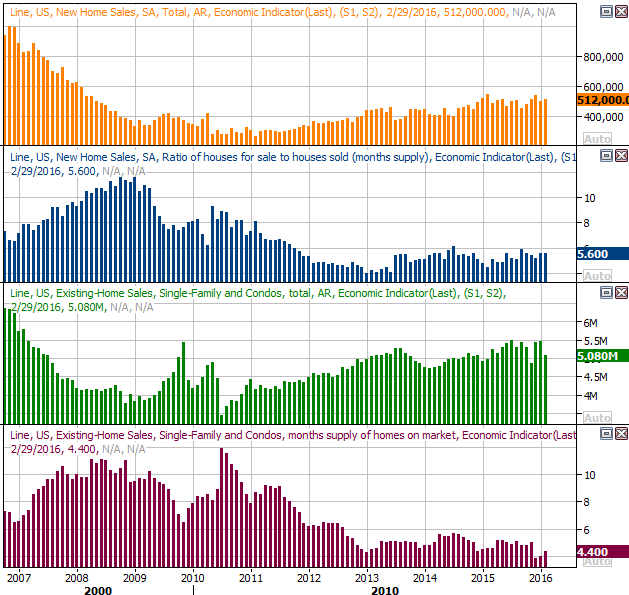
Source: Thomson Reuters
Stock Market Index Analysis
A week ago, stocks were fighting for their bullish life, teetering on the edge of what would have been a short-term breakdown. This past week, though it might be a stretch to say the market is back in a strong rally, it's at least making higher highs and moved away from the brink of a mini-meltdown.
Then again, we're once again forced to acknowledge the market - near these levels - has something of an overvaluation problem.
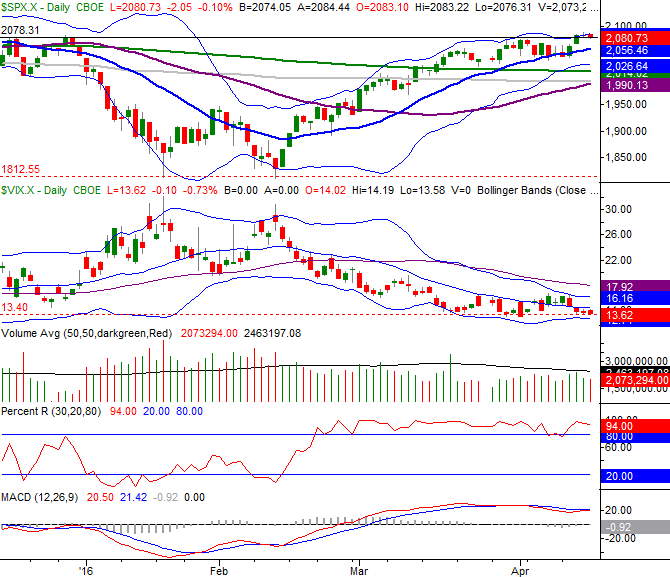
The daily chart of the S&P 500 below tells the tale. Before the bears could decidedly pull it below the 20-day moving average line late last week or early this week, a bullish jolt on Tuesday reversed that weakness and ended up carrying the index above a prior peak at 2078. The S&P 500 even closed above that level. There's no denying, however, the momentum enjoyed in late-February and early-March has yet to be fully rekindled.
S&P 500 & VIX Daily Chart
Chart created with TradeStation
Don't misread the premise - the trend is bullish. As of the end of last week, the BigTrends TrendScore for stocks was at 90 (out of 100). Technically speaking, the Percent R indicator has confirmed bullishness. The MACD indicator - which indicated a bearish divergence two weeks ago - is on the verge a bullish divergence again.
It's not a great bullish undertow. There's a distinct lack of volume behind it, with most traders still looking for serious earnings growth that will justify relatively frothy forward-looking P/E ratios. It is, however, a bullish undertow, and there's a thick layer of technical support all between 1990 and 2056. As long as that support holds up, we'll have to give the benefit of the doubt to the bulls.
The weekly chart of the S&P 500 puts things in a different perspective, though no more or less bullishly.
It's in this timeframe we can see we're now into our third week of progress above a major resistance line (dashed) that extends back to the mid-2015 peak. With not much else to get in the way immediately, it looks as if the S&P 500 has a clear path to the November peak near 2116, and more likely up to the ultimate peak of 2135.
S&P 500 & VIX Weekly Chart
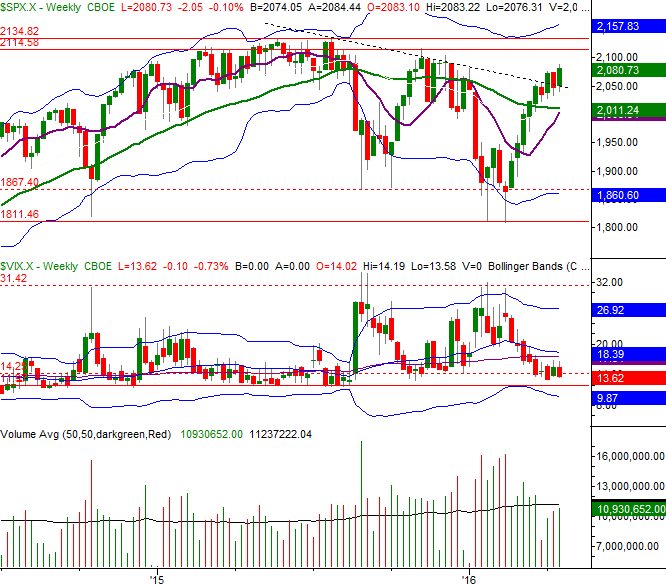
Chart created with TradeStation
That path isn't quite as clear as it may seem with just a quick glance, however.
For starters, once again we're reminded the CBOE Volatility Index (VIX) (VXX) is already near what may well be an absolute low level near 12.0. It leaves room for a little more upside, but not a lot.
The other ceiling isn't evident on our chart but is undoubtedly out there.. the market's valuation, and what we can reasonably expect going forward based on the new batch of earnings data now that new earnings reports are starting to roll in. Investors may not be willing to bid the market up anymore until the risk of doing so is justified.
As of the latest look, the S&P 500 is valued at a trailing P/E of 20.7 (the trailing P/E is based on Q1's assumed earnings) and a forward-looking P/E of 16.95. That's pushing the limits of what traders will pay, creating some pushback between the current level for the S&P 500 and the ceiling near 2135.
Bonds Go From Good to Great
It remains to be seen how long the trend will last, but if we get more of the same lackluster economic data we got last week and/or earnings are even seemingly disappointing, the Federal Reserve will have even more room and reason to delay the next interest rate hike. And, the market is already pricing that reality in, judging from the recent action in the bond market.
The chart of long-term Treasury bond (TLT) prices and the corresponding chart of the long-term bond yields illustrate this idea. With last week's lull in rates and rekindled bond rally, some short-term technical support and resistance lines were confirmed.
Long-Term Treasury Bond Price & Yield Chart
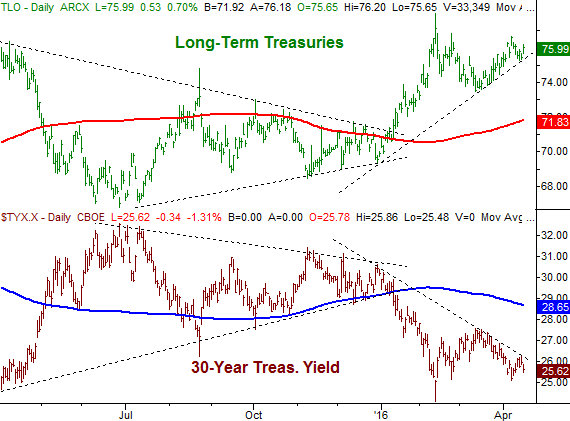
Chart created with TradeStation
Clearly there are no guarantees about the future, but this trend is pretty well founded now, and could really get going in earnest if the U.S. Dollar (UUP) continues to deteriorate the way it hints it's trying to.
Trade Well,
Price Headley
BigTrends.com
1-800-244-8736