Weekly Market Outlook - On The Verge Of A Bigger Pullback?
Weekly Market Outlook - May 16, 2016
The market may have started the previous week on a bullish foot, but it certainly didn't end the week on one. Not only did the S&P 500 (SPX) (SPY) log three straight losing days to end last week's trading, but it broke below a key support level it couldn't really afford to break. Stocks still aren't past the point of no return yet, but it's alarmingly close.
We'll dissect the odds below after running down last week's and this week's major economic headlines.
Economic Data
Not a lot of economic news worth exploring from last week. The only items of real interest were both unveiled on Friday... last month's producer price inflation rate, and April's retail sales.
As for producer inflation -- which will serve as something of a preview for this week's consumer inflation news -- wasn't quite as brisk as supposed. Overall PPI was up 0.2% versus expectations for a 0.3% uptick, but core PPI (sans food and energy costs) was only up the expected 0.1%. On an annualized basis, overall PPI is only 0.1%, and a mere 0.9% on a core basis.
Producer Price Inflation Chart
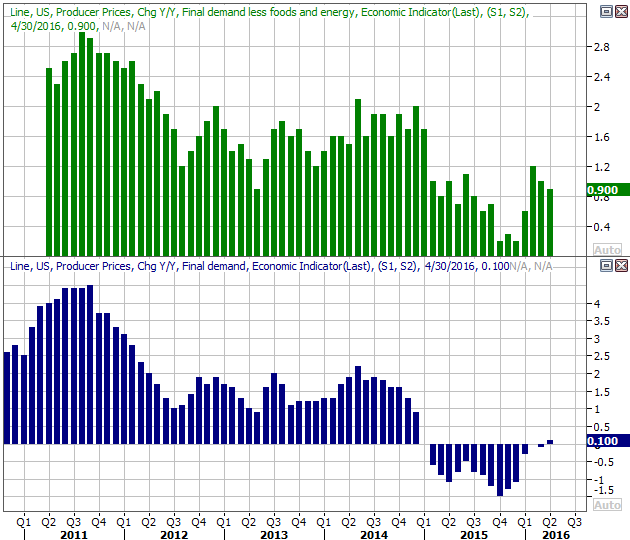
Source: Thomson Reuters
As for retail sales, April's consumer spending was a pleasant surprise. Spending grew 1.3% overall, and was still higher by 0.8% after taking automobile sales out of the equations. Retail sales are not growing "leaps and bounds," but they are making steady forward progress in all categories, now including gasoline/filling stations.
Retail Sales Chart
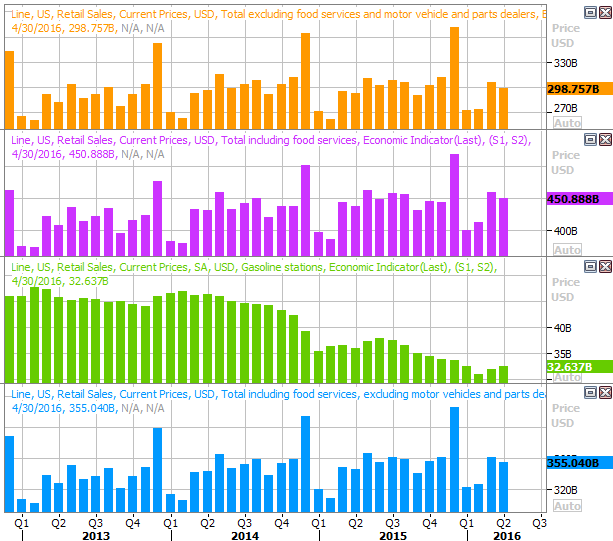
Source: Thomson Reuters
Everything else is on the following grid:
Economic Calendar
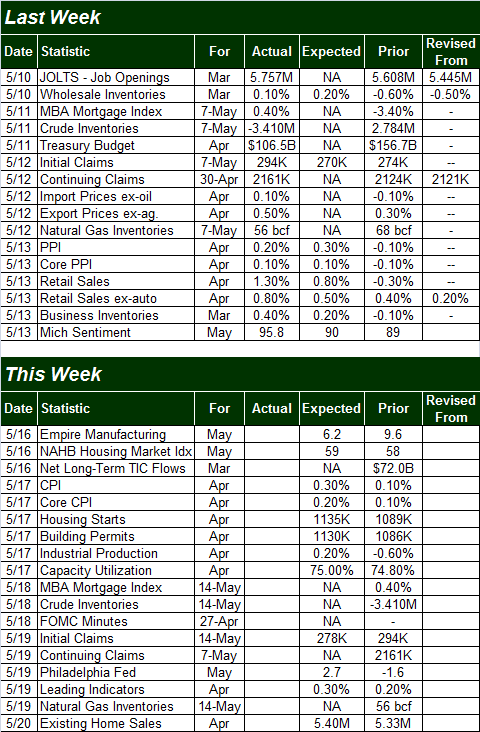
Source: Briefing.com
This week will be a little busier, and Wednesday's release of the minutes from the most recent FOMC meeting will likely be the centerpiece. It's not a scheduled interest rate decision date, though Janet Yellen could use it as such if merited. It's not apt to happen though. If anything, Yellen is apt to be looking to delay a rate hike as long as possible because ... last month's consumer inflation rate is apt to be on the tame side. The pros are calling for a 0.4% increase overall, and a 0.2% increase on a core basis. Annualized inflation rates are now 0.85% overall, and 2.2% on a core (ex-food and ex-energy) basis.
Consumer Price Inflation Chart
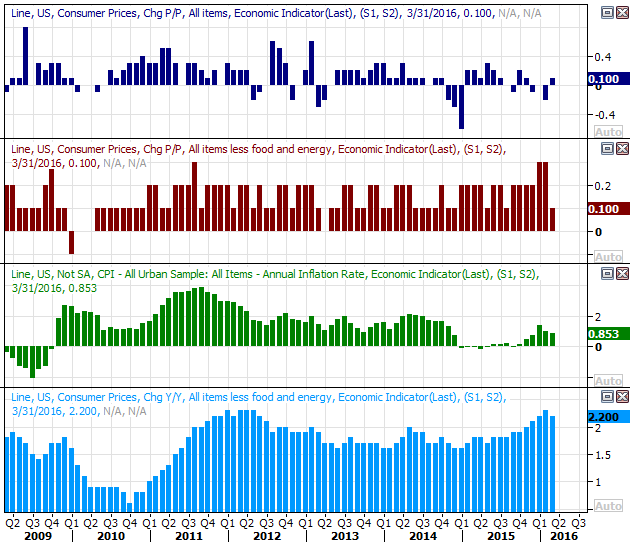
Source: Thomson Reuters
Also this week we'll get last month's industrial productivity and capacity utilization numbers. We desperately need a reversal of the strengthening downtrends from both. The market can shrug off a bit of downside volatility, but this deterioration has reached problematic levels.
Capacity Utilization and Industrial Productivity Chart
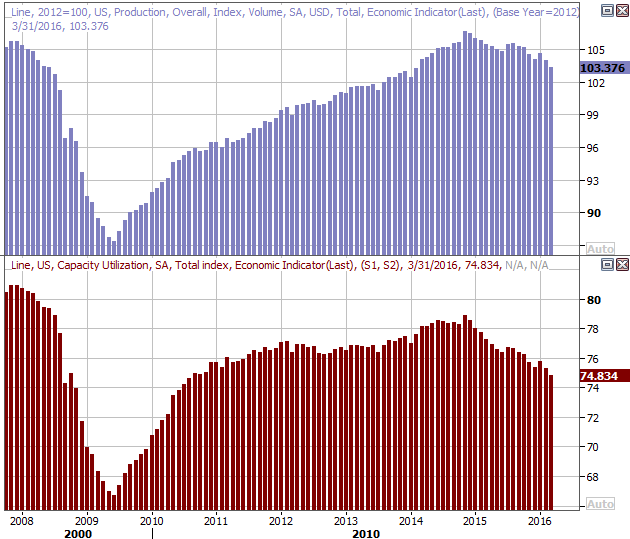
Source: Thomson Reuters
The bulk of these lulls are the result of a slow-down from the oil and gas sector, but that's starting to have a ripple effect.
Finally, keep an eye out for last month's housing starts and building permits, also slated for release on Tuesday. Economists are looking for slightly better numbers than the ones we got for March. We need a strong showing here too. The advance from the 2010 low seems to be stalling.
Housing Starts and Building Permits Chart
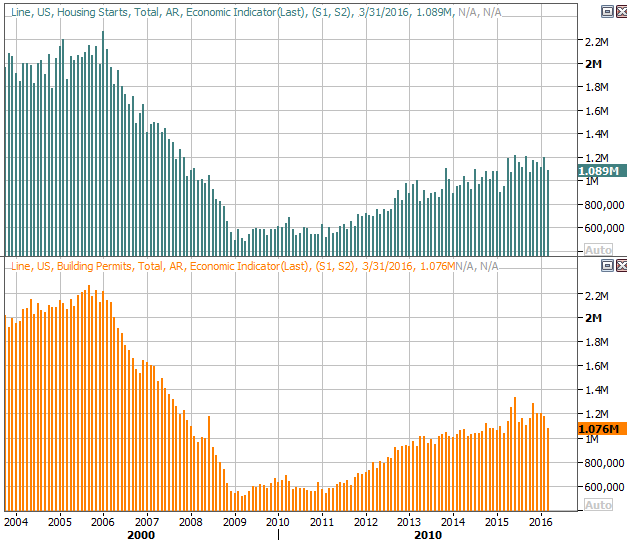
Source: Thomson Reuters
Stock Market Index Analysis
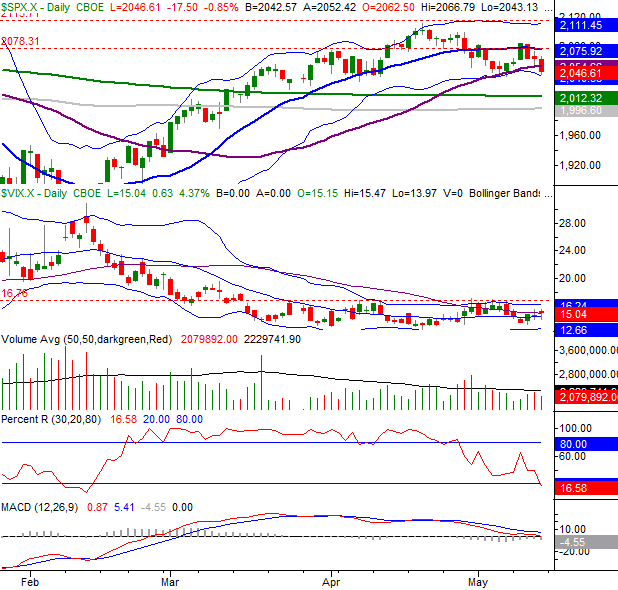
Last week's loss wasn't earth-shattering. The S&P 500 only lost about 0.5% of its value when all was said and done. It was a big 0.5% though, as the index broke under a critical support line, and a couple of other indicators drifted into bearish or near-bearish territory.
The daily chart of the S&P 500 looks tempered enough with just a quick glance. Take a closer look though. Unlike in the previous week, last week the index didn't find support at its 50-day moving average line (purple). Instead, it broke below that key line... for the first time in several weeks. The 100-day and 200-day moving average lines (gray and green, respectively) are still below the index, possibly ready to act as a floor. It remains to be seen if either will act as such, however.
S&P 500 & VIX Daily Chart
Chart created with TradeStation
It's not just the break below the 50-day moving average line acting as a red flag though. The Daily Percent R line is also back below the 20 threshold, setting up a potential confirmed sell signal. That confirmation will take shape after the next uptick from the Percent R line that does NOT break back above 20, and then moves lower again on the same day the S&P 500 moves to a lower low. [It's complicated. We'll point it out to you if and when it happens.]
At the same time, the MACD lines are falling, and close to breaking below the zero level... which confirms the strength of the selling.
With all of that being said, perhaps more than anything else right now we're watching for the CBOE Volatility Index (VIX) (VXX) to break above a ceiling around 16.7 as a confirmation that the market has indeed assumed the worst for stocks. The VIX has toyed with a break above that line a few times since late March, but never cleared it. This time could be different.
Odds are good we'll see several of these clues materialize at the same time the S&P 500 falls past the point of no return.
Zooming out to a weekly chart of the S&P 500, this brewing pullback still makes a great deal of sense. The February/April rally looks more or less like a repeat of the September/October rally, complete with the same basic ceiling. If the rollover effort this time around looks so much like the prior one, it stands to reason it will end the same, and end up at the same bottom.
S&P 500 & VIX Weekly Chart
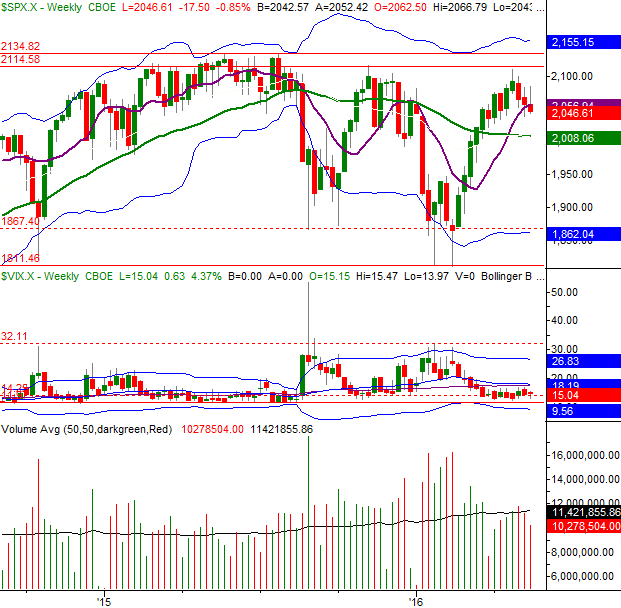
Chart created with TradeStation
On the other hand, this pullback so far does differ from the November/January selloff. This time around, the total volume behind the selloff is waning rather than growing. If this selloff is to last, it should be gathering more participants rather than losing them. On the other hand.....
Since we've taken looks at it recently - in this Weekly Market Outlook as well as at the BigTrends.com website - here's an updated view of the up-volume/down-volume comparison, and the Chaikin line (think of the Chaikin line as a volume-weighted momentum line). The NYSE's down-volume trend surpassed its up-volume trend a couple of weeks ago, and we're about one day away from the Chaikin line breaking below the zero level. That break below zero has historically been a good sell signal.
S&P 500, NYSE Up/Down Volume, Chaikin Line Chart
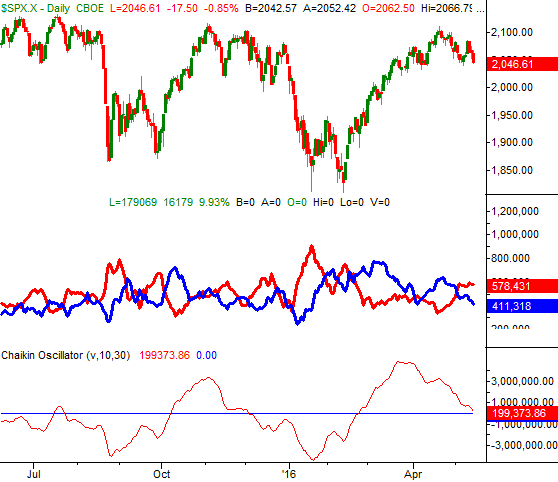
Chart created with TradeStation
How does one rectify the shrinking amount of total volume but the growing degree of bearish volume. It's still a net-bearish environment, though not a decidedly bearish situation.
Whatever the case, while the bears are doing some damage now, stock's haven't fallen over the cliff's edge yet. The 100-day and 200-day moving average lines for the S&P 50 have yet to be broken, and we don't have any bearish confirmations yet. The BigTrends TrendScore ended last week at a near-perfectly neutral 49.4; it needs to be below 30 to be bearish. We're not there yet.
The smart-money move here is waiting until stocks commit to one direction or another, and that's a tricky proposition from here, although the bias looks to the downside currently.
Trade Well,
Price Headley
BigTrends.com
1-800-244-8736