Weekly Market Outlook - New Year, New Chart Problems
Weekly Market Outlook - January 3rd, 2016
When push came to shove as the end of the shortened trading week (and last week of the year), the bears were doing most of the shoving. Namely, thanks to Friday's last-minute selling, the S&P 500 (SPX) (SPY) finished the week down 0.8%. That translates into a small loss of 0.7% for all of 2015.
Will 2016 be any different? That remains to be seen, but we certainly didn't end 2015 on a high note. The good news is, there's little correlation between the market's tone at the end of one year and its tone at the beginning of the next.
We'll look at the good, the bad, and the ugly of the market below, after a look at last week's and this week's economic news.
Economic Data
It wasn't a huge week last week in terms of economic numbers, but we did get a couple of big ones.
One of the more pressing data nuggets we get was December's consumer confidence score from the Conference Board. After sizeable setback in November, last month's score popped back up from 92.6 to 96.5. One month doesn't make a trend - especially when the data has been as choppy as it's been for a for a year now - but seeing the comparable Michigan Sentiment Survey score now rise for several months in a row, it's not difficult to take last month's improved consumer confidence reading at face value. Besides, the long-term trend is still a bullish one.
Consumer Confidence Charts
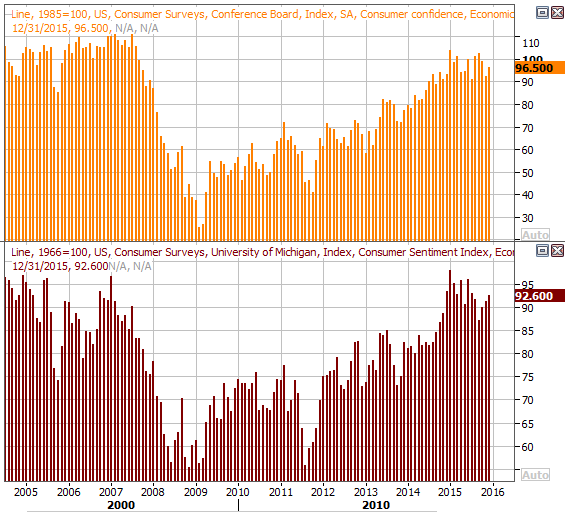
Source: Thomas Reuters
The only other item of any real interest last week was the Chicago PMI (Purchasing Manager's Index) report. It went from bad to worse. That is already under the recessionary-indicating reading of less than 50.0 with November's score of 48.7, purchasing managers lowered that indicator to only 42.9 in December. That's the lowest reading since 2009, and at least a reason for concern even is not yet a reason to panic.
Chicago PMI Chart
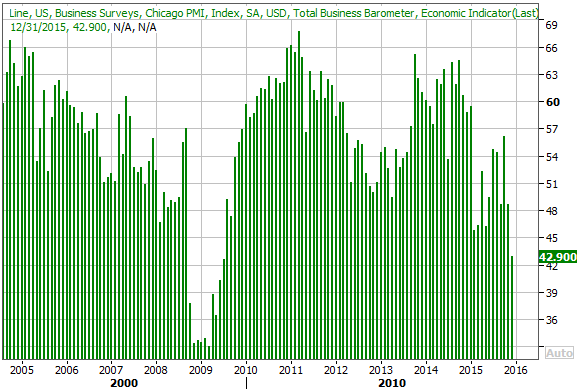
Source: Thomas Reuters
All the other data is on the following grid:
Economic Calendar
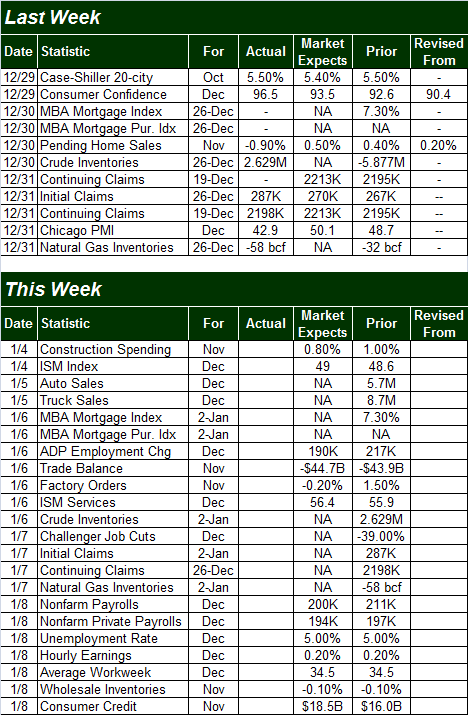
Source: Briefing.com
This week is going to be a busy one, but the highlight will undoubtedly be Friday's employment report for December. Although economists expect to see net job growth again, it won't be quite as strong as November's job growth, and it won't be enough to move the unemployment rate needle from 5.0%. Still, that's a pretty solid score, and is inherently tough to move much below that level even in a decidedly strong economy.
Unemployment Rate and Job Growth Chart
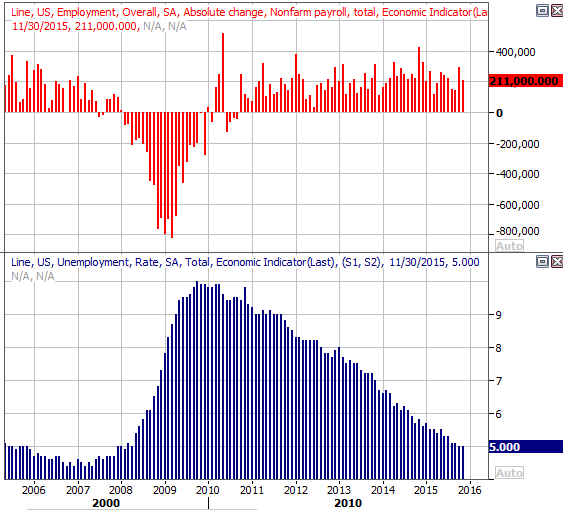
Source: Thomas Reuters
Stock Market Index Analysis
Don't sweat last week's weakness too much. It was anything but a typical week. Aside from the sheer lack of participation in trading (a lot of pros took the week off altogether), it was the last chance traders had to lock in tax losses before the end of the tax year. Traders may or may not be in the same mood when things get going this week.
On the other hand, where - and how - we ended last week is where and how we have to start trading this week, so last week's action is well worth scrutinizing.
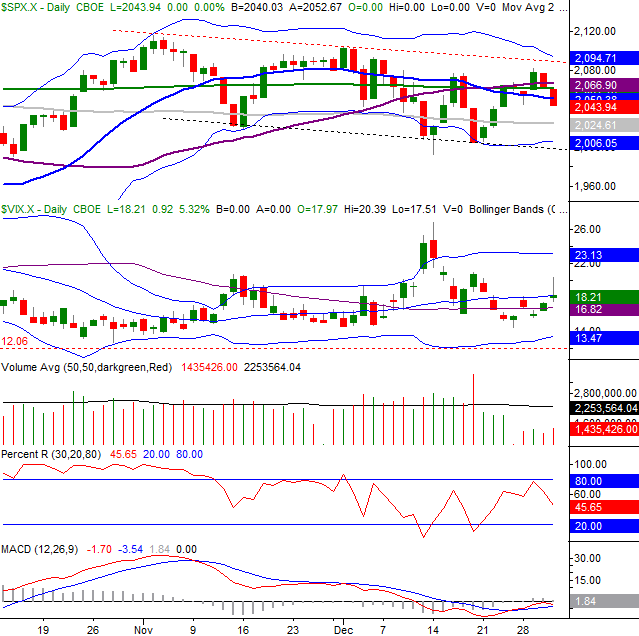
Broadly speaking, the bigger trend is slightly bearish, but there's still plenty of opportunity for the bulls to correct the course before the sellers take complete control.
This isn't tough to see on the daily chart of the S&P 500. The index ended the week below most of its key moving average lines, but remains above the lower Bollinger band as well as above a falling support level (dashed) that extends back to early November. That floor around 2000 will have to fail first before we can assume the worst for stocks. And even then, we'd want to wait for a Percent R confirmation of that downtrend before committing to it.
S&P 500 & VIX Daily Chart
Chart created with TradeStation
Yet, when we zoom out to a weekly chart of the S&P 500, it's more difficult to remain optimistic. It's on this chart we can see a streak of lower highs and lower lows. We can also see the index is not only under most of its key moving average lines, but that those lines are all pointing in a downward direction.
S&P 500 & VIX Weekly Chart
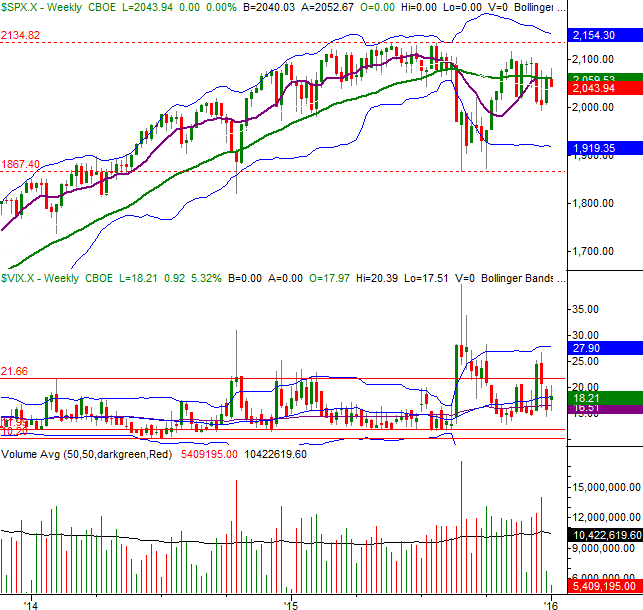
Chart created with TradeStation
It's also on this chart we can see if the floor at 2000 doesn't prop the market up, the next potential floor isn't until we get closer to 1900.
The NASDAQ Composite (COMP) has its own support levels it's close to testing. In some ways the composite looks stronger than the S&P 500, and in other ways it looks closer to a meltdown. Specifically, the NASDAQ is still holding above its 200-day moving average line (green), but it would only take a minor pullback from its current levels to move under a couple of very long-term support levels (dashed). If those support lines should break, the next floor is the lower Bollinger band at 4650.
NASDAQ Composite & VXN Weekly Chart
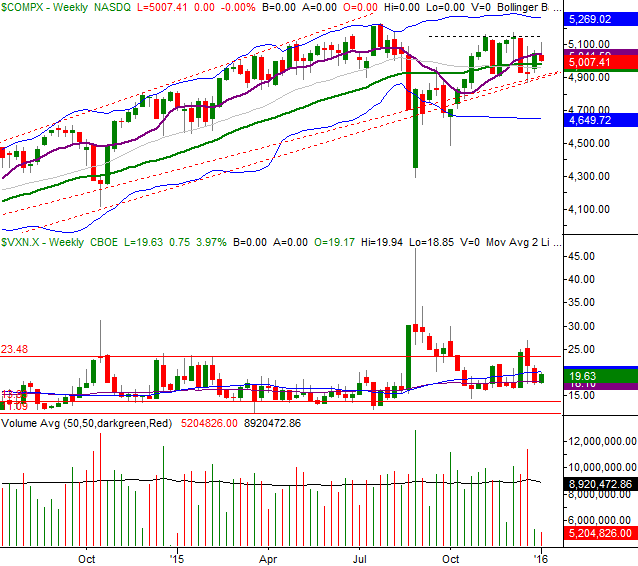
Chart created with TradeStation
Not surprisingly, the BigTrends TrendScore ended 2015 right in neutral territory... a score of 52.5, where 100 is highly bullish and 0 is very bearish.
The challenge in situations like this is simply exercising patience and letting the market tip its hand rather than trying to guess what cards it's holding.
U.S. Oil Producers Remain Stubborn
While 2015 will be remembered for several reasons, for traders, there's no doubt the year will be marked as the one during which Oil prices (USO) did the unthinkable.
The industry has allegedly adjusted in the meantime, reportedly curtailing production as a means to crimp supply and therefore push prices back up to profitable levels. A closer look at the data, however, suggests the U.S. oil industry (XLE) (OIH) has talked a lot but little has actually changed in terms of output and supply.
The chart below plots (from top to bottom) the amount of refinery capacity we're utilizing, the amount of oil were putting into refineries, the amount of oil we've recently imported, and the amount of oil currently stockpiled. Though we've seen all of them ebb and flow, if anything, on a long-term basis they all seem to be suggesting oil production in the U.S. is increasing even if it's unprofitable productivity.
U.S. Oil Industry Production, Supply Chart
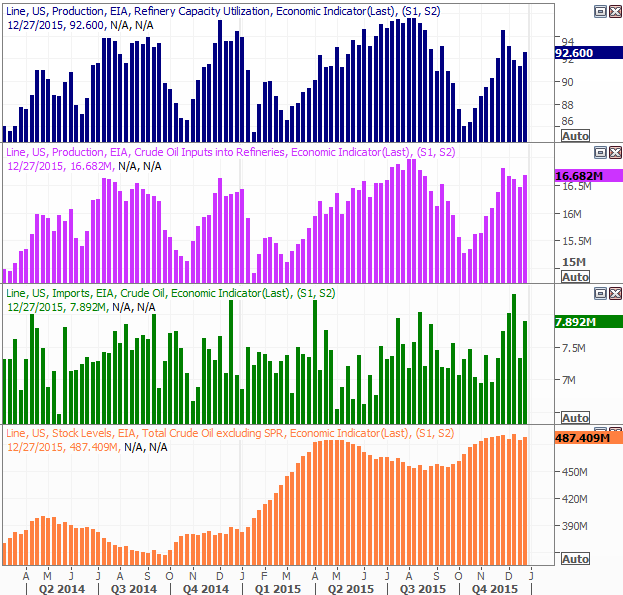
Source: Thomas Reuters
The implication is simple - the changes that need to happen to lead to a sustained improvement in the price of oil haven't happened yet... contrary to a lot of predictions regarding crude prices in 2016. That's not to say they can't or won't change at some point this year. It is to say, however, we can't take the all the commentaries and touted plans to lower production at face value.
Trade Well,
Price Headley
BigTrends.com
1-800-244-8736