BigTrends.com Weekly Market Outlook - October 10, 2016
The bears may not have done any real damage last week, but the bulls certainly didn't accomplish much either. A huge technical resistance level not only held the buyers back, but further solidified. Then again, support is firming up as well, perhaps leading up to a showdown of sorts after a three-month consolidation phase.
Fanning that potential volatility will be Q3's earnings season, which unofficially begins on Tuesday with numbers from Alcoa (AA).
We'll look at how the market index's floors and ceilings are squeezing stocks below, after painting a bigger picture with the broad brush strokes of the most recent economic reports.
Economic Data
There was plenty of economic news to sift through last week, though none as big as September's job-growth report from Friday.
It was.... so-so. The economy added 156,000 new payrolls, though the unemployment rate actually moved up from 4.9% to 5.0% as a large swath of people jumped into (or back into) the labor market without actually securing employment. It's not a report that's bad enough to take a rate-hike off the table, nor is it good enough to guarantee one in the foreseeable future. It's a figure that simply maintains the status quo, whatever that is at this time.
Job Growth, Unemployment Rate Chart
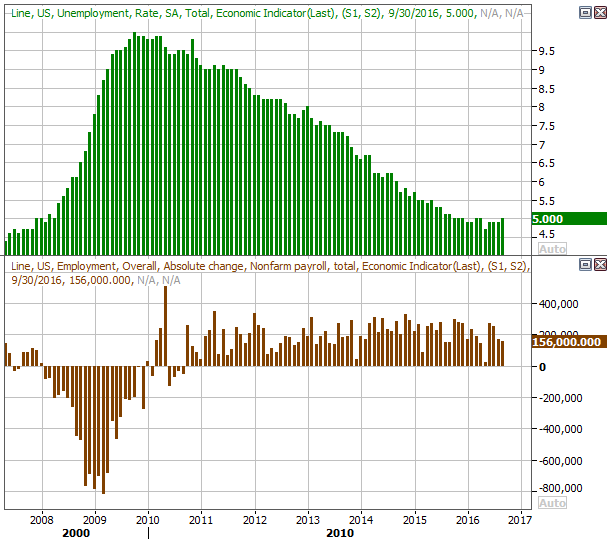
Source: Thomson Reuters
It was also a big week for ISM data, with the manufacturing index being posted on Monday and the services index being posted on Wednesday. Both were up from August's levels, and both are currently above the critical 50 level that indicates expansion rather than contraction But, the bigger trend here has been less decisive.
ISM Index Chart
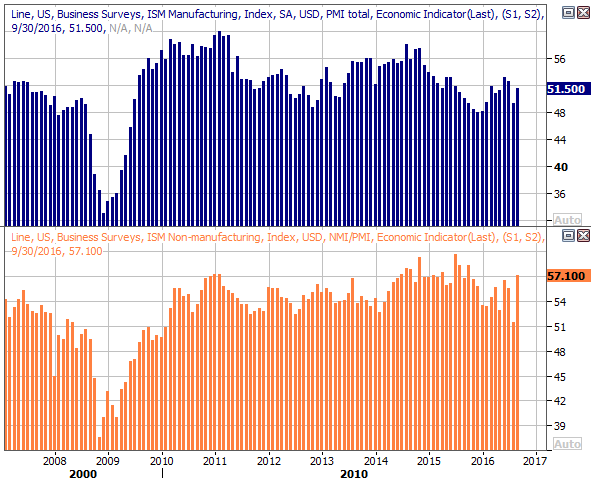
Source: Thomson Reuters
Finally, after a stumble in August, automobile sales perked up again in September. The annualized pace of car sales ramped up to 5.3 million units, while truck sales jumped to a pace of 8.52 million. It's still too soon to say "peak auto" wasn't really a peak, but the industry is still holding its ground.
Annualized Automobile Sales Chart
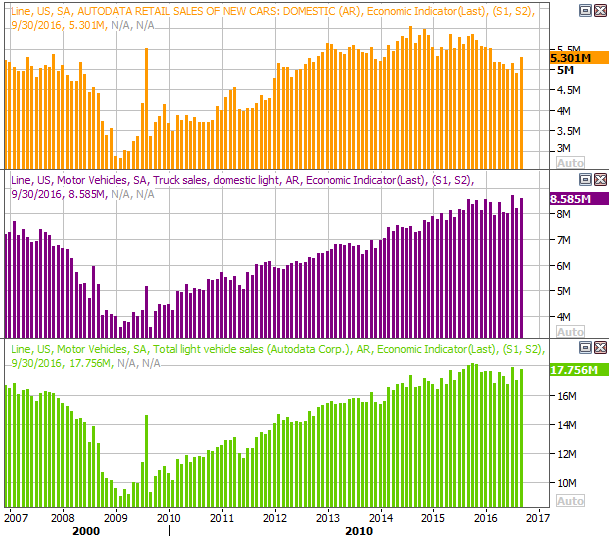
Source: Thomson Reuters
Everything else is on the following grid:
Economic Calendar
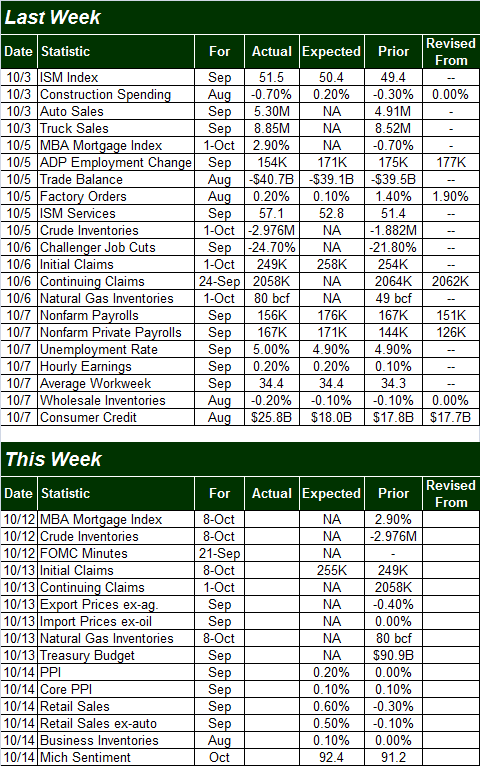
Source: Briefing.com
This week won't be quite as busy, though we've got a couple of major announcements in the lineup.
The first one will be the release of the minutes of the most recent FOMC meeting. They'll be out on Wednesday. There's no "data" per se. Instead, look for the rhetoric and language used as a barometer for how close we may be to a rate hike.
On Thursday we'll hear about September's producer inflation, though that won't mean as much as next week's consumer inflation report. Rather, Thursday's biggest data will be a retail sales update for last month. the pros are looking for 0.6% growth overall, and a 0.5% increase when taking automobile sales out of the equation. Those are month-to-month comparisons, however. On a more meaningful year-over-year basis, spending in almost all stratifications has held steady between 2% and 3%.
Retail Sales Year-Over-Year Growth Chart
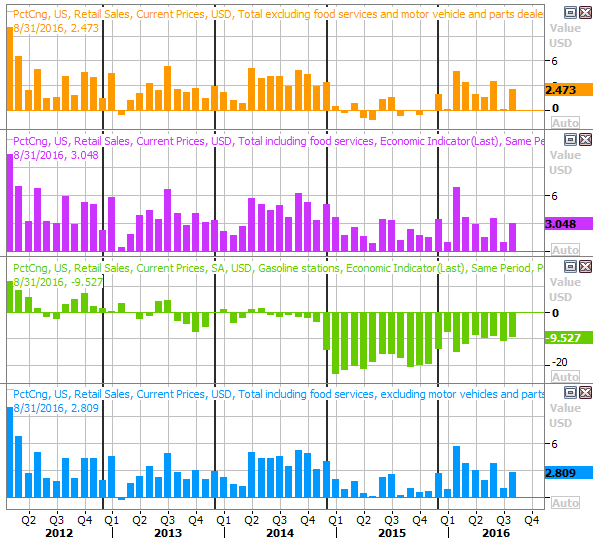
Source: Thomson Reuters
Stock Market Index Analysis
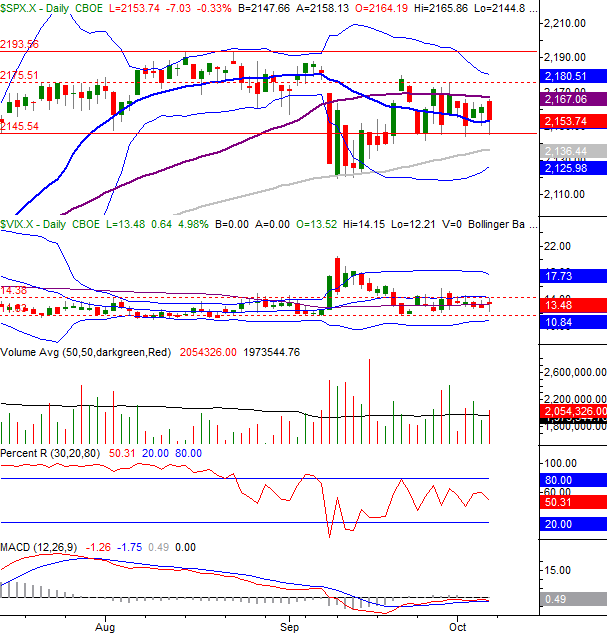
In short, the market is caught between a rock and a hard place. It's not difficult to see this on the key index's charts either. Take a look at the daily chart of the S&P 500 (SPX) (SPY) below. The index tried to clear the 50-day moving average a couple of weeks ago, but just couldn't do it. On the flipside, a support level has taken shape at 2145. That's where the index made several lows over the course of the past week and a half, but the bulls wouldn't yield. That's given the 100-day moving average line (gray) and the lower Bollinger band time to move into an intercept course with that support level. Likewise, the S&P 500's upper Bollinger band is close to intercepting the recent ceiling around 2175, making it a stronger resistance level.
S&P 500 & VIX Daily Chart
Chart created with TradeStation
This convergence of support and resistance will apply pressure to stocks from both sides, eventually leading to a break out of the tightening range. As for which direction that may be though, based on this daily chart, it's anybody's guess. The MACD lines are flattening right around the zero level, and the Percent R line is waffling right in the middle of its 20 and 80 thresholds. Even the CBOE Volatility Index (VIX) (VXX) is stuck in a narrow range. That said...
While the market can and will rally even while the VIX is near absolute lows, that makes it less likely a significant rally will occur.
Zooming out to a weekly chart of the S&P 500 doesn't help much. In this timeframe we can see the market rallied in 2014 and early 2015 when the VIX was at extreme lows, but once that changed in the latter half of 2015, it changed in a big way. Those were painful corrective moves.
S&P 500 & VIX Weekly Chart
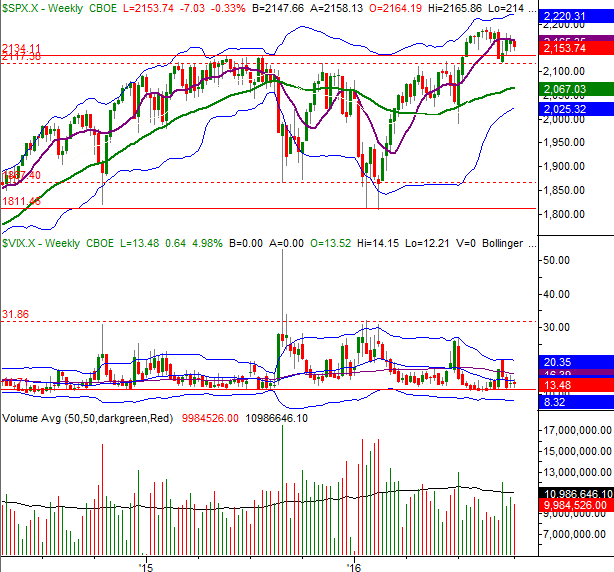
Chart created with TradeStation
And, once again we can see just how overbought the S&P 500 is now after its 20% runup since February. That's an awful lot of bullishness in a short period of time, setting up a lot of profit-taking potential. We'll see.
A look at the daily chart of the NASDAQ Composite (COMP) only further muddies the waters. The NASDAQ is still within reach of the record high hit just a couple of weeks ago, and as of Friday appears to be finding support at the 20-day moving average line; momentum is still compelling... unless it isn't. The MACD lines just turned bearish here.
NASDAQ Composite & VXN Daily Chart
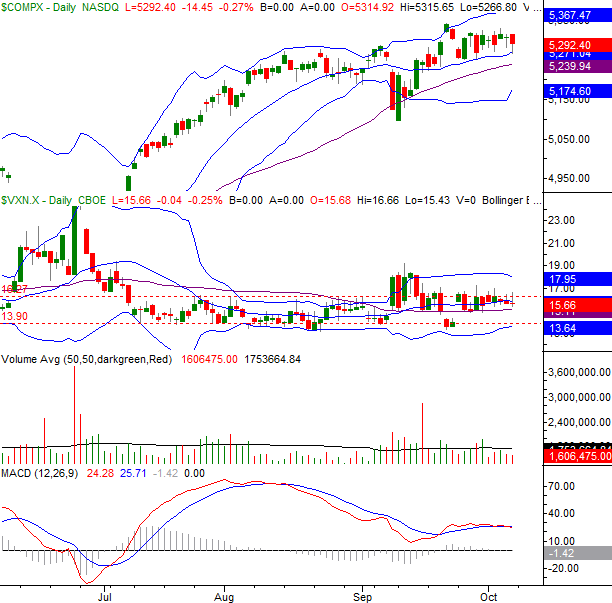
Chart created with TradeStation
The moral of the story? Be prepared for anything. A big move is likely coming, but the direction is uncertain at this time.
That being said, there is likely a good way to spot an actual breakdown - watch the VIX and the Nasdaq Volatility Index (VXN). Specifically, look for either or both of them to move above their current technical ceilings as a sign that traders are finally actually expecting a pullback, and defending against it. If they expect it, they're apt to make it happen. The indices still need to break under their floors, however. For the S&P 500, that's something around 2137. For the NASDAQ, that's wherever the lower 20-day Bollinger band is at the time. (Currently, it's at 5175.)
Trade Well,
Price Headley
BigTrends.com
1-800-244-8736