Weekly Market Outlook - Hanging By A Thread?
BigTrends.com Weekly Market Outlook
Although stocks were never significantly into profitable territory at any point last week, at the very least on Thursday it looked like we might stabilize with just a very minor loss. The bears had other plans on Friday, however, sending the market 1.85% lower that day to the lowest close in nearly two weeks.
And yet, it's worth noting that neither the S&P 500 (SPX) (SPY) nor the NASDAQ Composite (COMP) broke under their most critical floors; we're still not past the point of no return yet. (We are, however, getting close to that point again.)
We'll explore it all below, as usual. But first, let's run down last week's and this week's key economic numbers.
Economic Data
There was plenty of economic data to sift through last week, but there's no doubt that the highlight was Friday's jobs report for January. The Department of Labor said the unemployment rate finally edged the below the high 5.0% level to reach 4.9%.
Unemployment Rate Chart
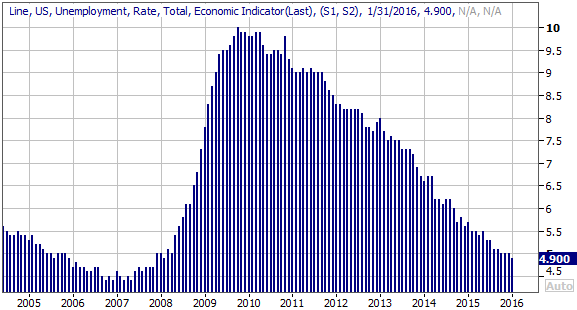
Source: Thomson Reuters
The DOL also said we added 158,000 new payrolls last month, falling short of the expected 183,000, and coming in well below December's to 251,000. Nevertheless, we're still into our sixth straight year of net job growth for each month of the year... even if some of those months were "just barely."
To the extent it matters, the ADP employment change report from earlier in the week said we added 205,000 new payrolls last month, topping that estimate for 190,000. Point being, we should probably be viewing data that's on the fence in a glass-half-full light.
The other big item worth a closer look from last week are the ISM indexes - manufacturing and services.
On the services side of the table, the ISM index scored 53.5, falling short of the expected reading of 55.0, but still above the 50.0 threshold that suggests a recession is underway. As for the manufacturing index, it rolled in at 48.2... just a bit short of the anticipated reading of 48.3, but more important, once again below the key 50.0 level.
ISM Index Charts
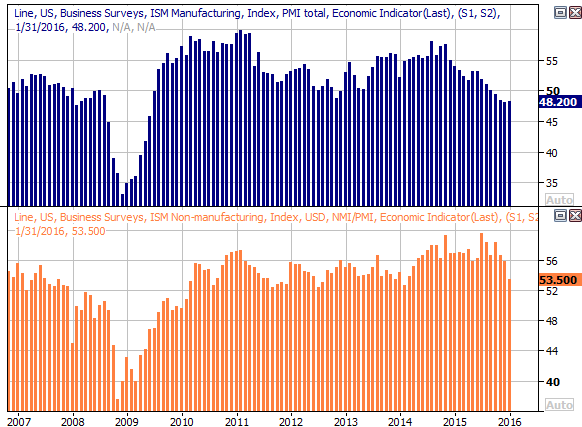
Source: Thomson Reuters
Although the ISM Manufacturing index ticked a little higher last month, it's clearly in a bigger picture downtrend, and has been below the 50 level for a few months though. This is a concern, particularly if the services index continues to slump as well.
All the other data is on the following grid:
Economic Calendar
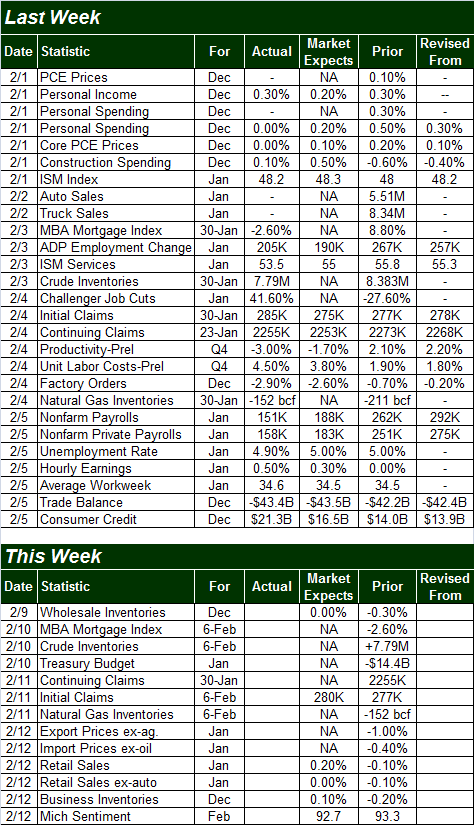
Source: Briefing.com
This week isn't going to be nearly as busy, nor as important. The main item we have a real interest in is Friday's Retail sales report for January. As of the latest look, overall retail sales are expected move higher by 0.2%, but they are expected to be flat when taking automobiles out of the equation.
We still contend the apparent weakness in retail sales is mostly attributable to weak oil and weak gasoline prices, which are still trending lower (even if to a lesser degree on a year-over-year basis). As our chart below illustrates, there's still a broad retail sales growth trend in most other categories.
Retail Sales Chart
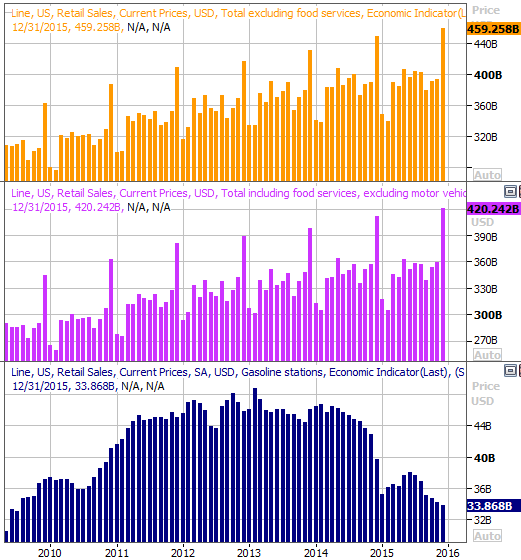
Source: Thomson Reuters
Stock Market Index Analysis
Although neither of the key indices we keep tabs on have broken below their last-ditch support levels, both are getting dangerously close to doing so.
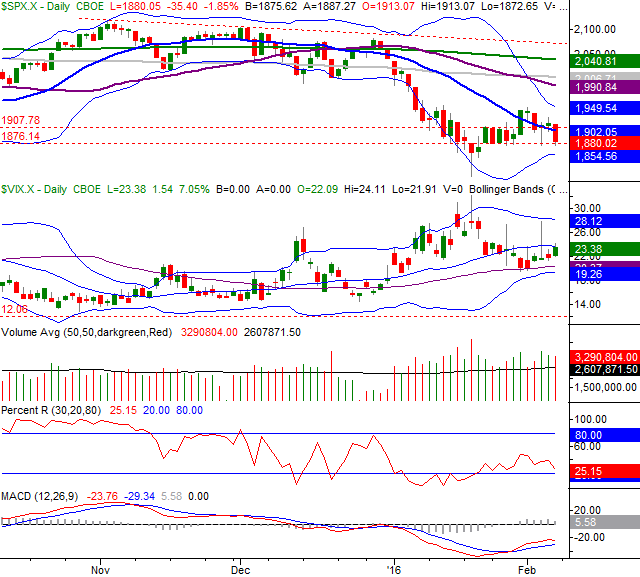
A big line in the sand for the S&P 500 was and still is 1876. That was the low hit several times a couple of weeks ago, the low from Wednesday, and basically the low from Friday's bearish session. There's clearly something about that level the bears are willing to test, but not break.
S&P 500 & VIX Daily Chart
Chart created with TradeStation
That being said, although the near-term momentum is bearish, we've yet to see two of the major technical red flags that would confirm a bearish trend has taken hold.
One of those bearish clues is, of course, a MACD crossunder. Any MACD crossunder is bearish, but those that occur under the zero level are particularly bearish. We've also yet to get a Percent R confirmation via a break under its 20 level and then a renewal of the Percent R downtrend on the same day the S&P 500 reaches a new low (with the Percent R line never moving back above 20 in the meantime).
That being said, the rising CBOE Volatility Index (VIX) (VXX) should be a concern for the bulls. Although it seemed to be capped at the 20-day moving average line as of Friday's session, the test of - and then bounce off of - the 50-day moving average line a week ago led to an upward reversal pretty much as scripted.
As for the NASDAQ Composite, an intermediate-term rising support line (dashed) fail to hold the index up on Friday, also allowing the composite to break under its lower 20-day Bollinger band. You can also see the Nasdaq Volatility Index (VXN) thrust above its 20-day moving average line and seems to have room and reason to at least keep forging ahead towards its upper band line at 30.8.
Yet, the NASDAQ has yet to break under its crucial horizontal support lines at 4309 and 4287. The former is last month's low, and the latter is the August low. Should the lower those two lines fail to hold the composite up, that could open the proverbial selling floodgates as there's no other support level in view.
NASDAQ Composite & VXN Daily Chart
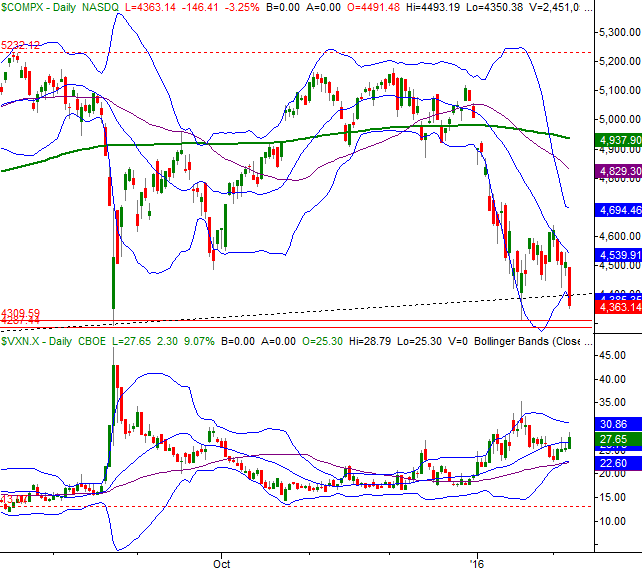
Chart created with TradeStation
The weekly chart of the NASDAQ offers more perspective on how close we are to a key breaking point, although the same weekly chart also tells us the VXN doesn't have a lot more structural room to move significantly higher. That's a broad clue that fear is at or near a bigger-picture peak... unless the 4287 floor breaks. If it does, all bets are off, even if there's little to no fundamental justification for another leg of selling.
NASDAQ Composite & VXN Weekly Chart
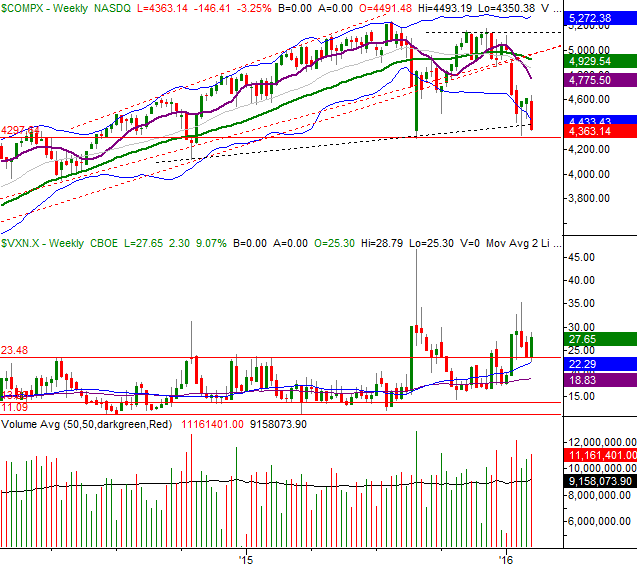
Chart created with TradeStation
Here's a look at the weekly chart of the S&P 500. It too is hanging by a thread, and like the VXN, the VIX appears to be nearing the structural ceiling, suggesting fear is at or near a peak. In turn, this implies the market selloff may be nearing an end even if the momentum is saying otherwise. As was the case with the NASDAQ Composite though, with chatter of a recession reaching a feverish pitch of late, should the S&P 500 fall below 1876, don't be shocked if the selling heats up. This is a weakness investors haven't seen in years, and though is little more than a garden variety market correction, the response to it could be abnormally volatile.
S&P 500 & VIX Weekly Chart
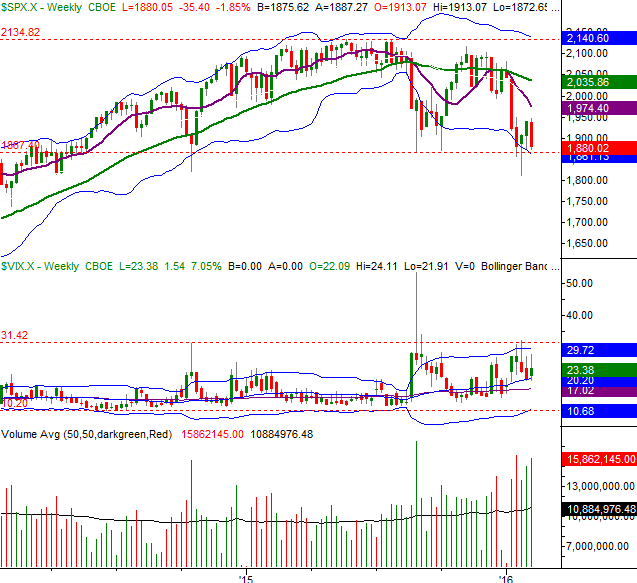
Chart created with TradeStation
The bottom line is, the bears have the edge in that they have the momentum, but don't be shocked if this is where the bulls make their stand. From a technical perspective and sentiment perspective, the buyers could still easily take control again. This week is going to be telling.
Trade Well,
Price Headley
BigTrends.com
1-800-244-8736