Weekly Market Outlook - Are Stocks Ready To Pivot?
Weekly Market Outlook - January 17th, 2016
Despite a couple of valiant efforts from the bulls, there was just nothing that could stop the raging bear last week. By the time the closing bell rang on Friday, the market was off by 2.2% for the week.... most of which came during Friday's selloff.
Was that enough to finally drive the market to a meaningful bottom and let stocks start to recover for a while? Most indices are still on the fence, but yes, there are some clues suggesting stocks are ready to pivot. The question is, can we trust those clues?
We'll weigh the risks and rewards below, after a quick look at last week's and this week's economic news.
Economic Data
Last week was plenty busy in terms of economic data, but none of the major numbers came until Friday. That's when we got December's retail sales data, last month's producer price inflation data, and December's industrial production and capacity utilization data. None of it was very encouraging.
If anything is to get the blame for Friday’s bearish end to an already-rough week, it would be last month’s retail sales data. The pros were expecting a 0.1% improvement overall, and a 0.3% increase when taking auto sales out of the equation. Instead we got a 0.1% decline on both fronts. Even so, it's worth noting that the census bureau's numbers are a bit squirrelly. Had it not been for rock-bottom low gasoline prices, retail sales across the board would have been up with or without the seasonal adjustment. The raw data on our chart below paints a more meaningful picture.
Retail Sales Chart
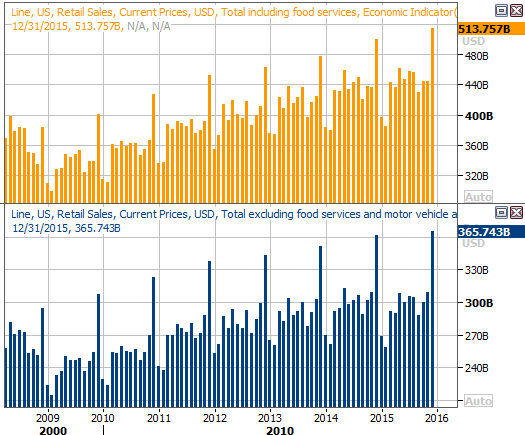
Source: Thomson Reuters
No need for a Producer Price Inflation chart - just know they were mostly in line with estimates. That is, overall producer inflation was down -0.2%, but taking food and energy out of the equation, they grew 0.1%. On an annualized basis, overall producer inflation stands at a rare of -1.1%, though on a core basis it's still only growing at an annualized pace of 0.3%. If this week's consumer inflation follows suit, there won't be a great deal of pressure on the Fed to pump interest rates up again.
As for capacity utilization and industrial production, productivity fell for a second month in a row, who is still relatively high and still in an uptrend. Capacity utilization, however, fell to a multi-year low reading of 76.5, and has been trending lower for quite some time now.
Capacity Utilization and Industrial Production Chart
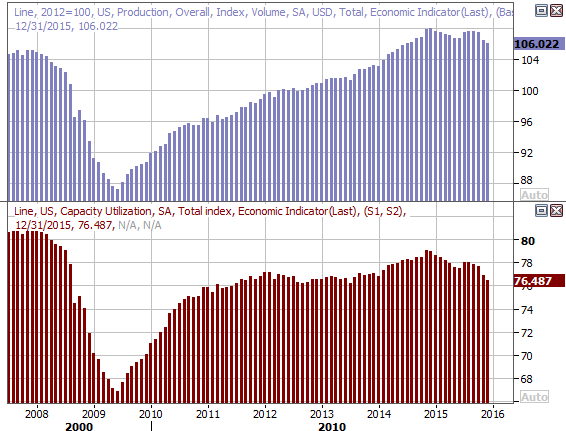
Source: Thomson Reuters
If both of these pieces of data start to trend lower at the same time, it’s a strong sign of an economic recession.
All the other data is on the following grid:
Economic Calendar
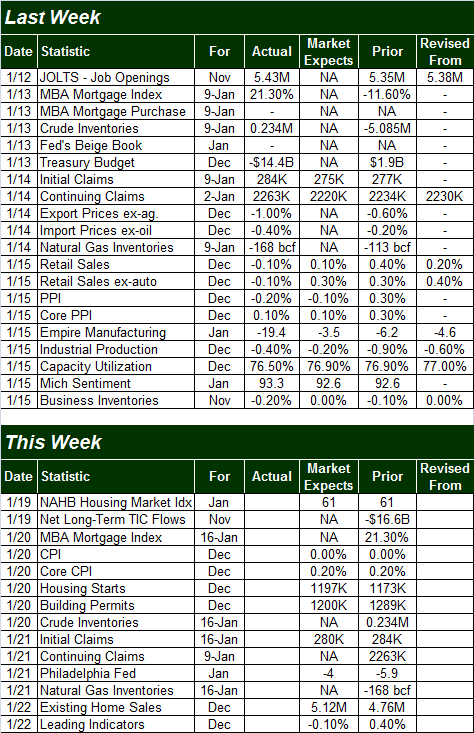
Source: Briefing.com
This shortened trading week won't be quite as busy in terms of economic numbers, but we'll get a couple of biggies.
The biggest of the big data in the queue is Wednesday's inflation report. Economists are calling for flat inflation overall, and only a 0.2% rise with food and energy taken out of the mix. That's not a lot, nor is the current annualized inflation rate of 0.5%. The annualized inflation rate without oil and food factored in is still a modest 2.0%... perhaps just enough for the Fed to justify another rate hike. If it lowers in the meantime though, that game changes.
We'll also get last month's housing starts and building permits on Wednesday; analysts are looking for mixed results on a seasonally-adjusted basis. The trend from both still looks bullish. A good report here could fan the bullish flames, while a weak report could push the market past its tipping point. This may be a more pivotal announcement than most investors realize.
Housing Starts and Building Permits Chart
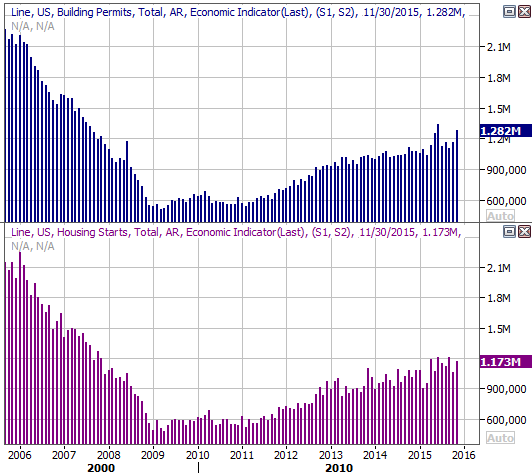
Source: Thomson Reuters
Similarly, Friday's report on existing home sales could be more market-moving than usual.
Stock Market Index Analysis
From a momentum perspective, there's no way of saying the momentum isn't bearish for stocks. The BigTrends TrendScore for the S&P 500 SPYders (SPY) (SPX) now stands at 9.8 (zero is fully bearish, and 100 is fully bullish). That's the end result of an 8.0% tumble over the course of just two weeks.
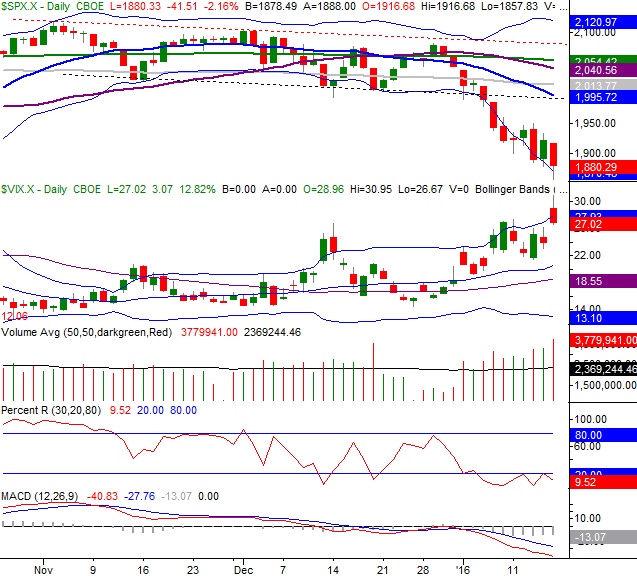
The uber-low TrendScore isn't the only strong hint we've entered a big downtrend. As our chart of the S&P 500 below shows, we got a confirmed Percent R bear signal as of Friday.
S&P 500 & VIX Daily Chart
Chart created with TradeStation
But is it too much, too fast? Perhaps. The weekly chart of the S&P 500 plainly points out that once the index hit a major support level at 1867 the bears backed off and the bulls started to nibble again.
S&P 500 & VIX Weekly Chart
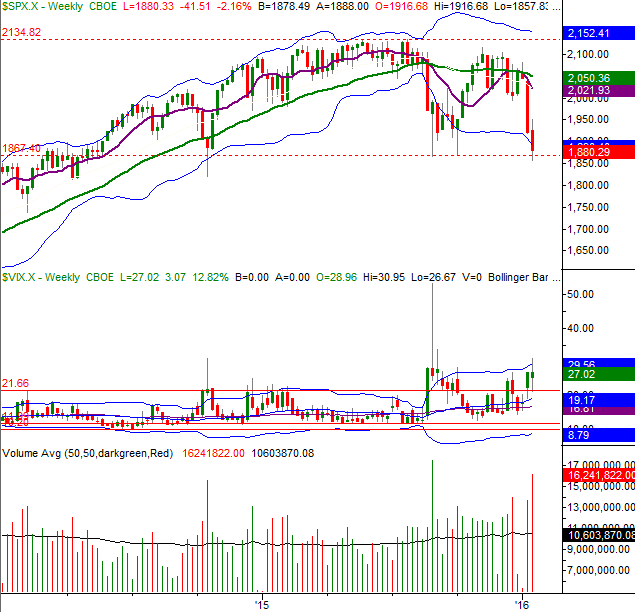
Chart created with TradeStation
Don't assume Friday's bullish pushback is going to get any real traction - that floor at 1867 was going to be contentious no matter what. The bears may still blow it away after a bit of a struggle. Only time will tell. It's really a question of whether this is just a temporary corrective move or the development of a new trend [yes, a rather obvious question, but without an obvious answer]. That being said...
The weekly chart gives rise to a couple of major concerns. One of them is the fact that the last two bearish weeks have unfurled on high and rising volume. That says this pullback has lots of participation, and so far is garnering more. That's one thing that makes this dip different from any of the other major pullbacks over the past few years.
The other curious detail is the way the CBOE Volatility Index (VIX) (VXX) seems to be starting to develop an uptrend rather than just spiking higher as it has with recent market pullbacks. This is a sign that the corrective move is calculated and not entirely surprising. Ergo, the S&P 500 may well break under 1867 yet. If it does, whether merited or not, the sheer panic could drive stocks to a technical bear market. That steep dip may end up being a wonderful buying opportunity. Again, this is still a day-by-day affair.
The NASDAQ Composite (COMP) hasn't yet tested its previous major low, but it is within striking distance of a major support level.. a line that does tag the last two key lows, the first of which extends all the way back to the October-2014 low. If the market sinks any lower that key line could become a make-or-break floor.
NASDAQ Composite & VXN Weekly Chart
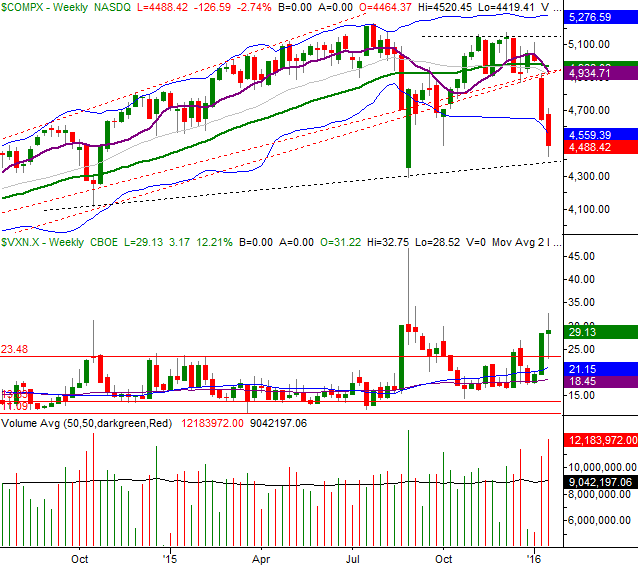
Chart created with TradeStation
Bonds, Yields Catapulted Out of a Rut
Veteran traders know that periods of low volatility (or shrinking volatility) are generally followed by period of high volatility (or expanding volatility), and vice versa. So, it should come as no surprise to most investors reading this that after an increasingly stagnant phase of shrinking consolidation by Bonds (TLT) and interest rates, both have broken out of narrowing trading ranges. The chart below tells the tale.
Long-Term Treasury Bond Values, Rates Chart
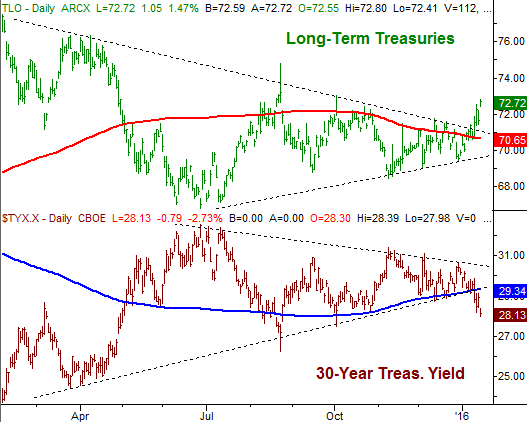
Chart created with TradeStation
Given the explosive nature of the moves, odds are good we could see some pushback this week. The damage (so to speak) is done though. This may well be the onset of a brand new trend that lasts a while.
Trade Well,
Price Headley
BigTrends.com
1-800-244-8736