Which Sectors Help, Hurt the Market's Overall Earnings?
With Q2's earnings season effectively over (96% of the S&P 500's (SPX) (SPY) constituents have reported last quarter's results), we can safely take a step back and draw some conclusions about the market's hot spots and sore spots. One of the easiest ways of doing this is by examining the changes in the makeup of the S&P 500's overall earnings at the sector level. That is, which sectors are chipping in more than usual to the S&P 500's bottom line, and which are contributing less?
As they say, read 'em and weep. Though energy (XLE) was sequentially better in that the loss it imposed on the market's overall earnings in Q2 was smaller than the loss is reported in Q1, both Q1's and Q2's loss from the energy sector this year were a bigger drag than the sector was on the overall market's earnings for the first and second quarters of 2015. Impressively, the basic materials sector (XLB) found a way to do more last quarter despite the fact that it still wasn't a great quarter for commodity prices.
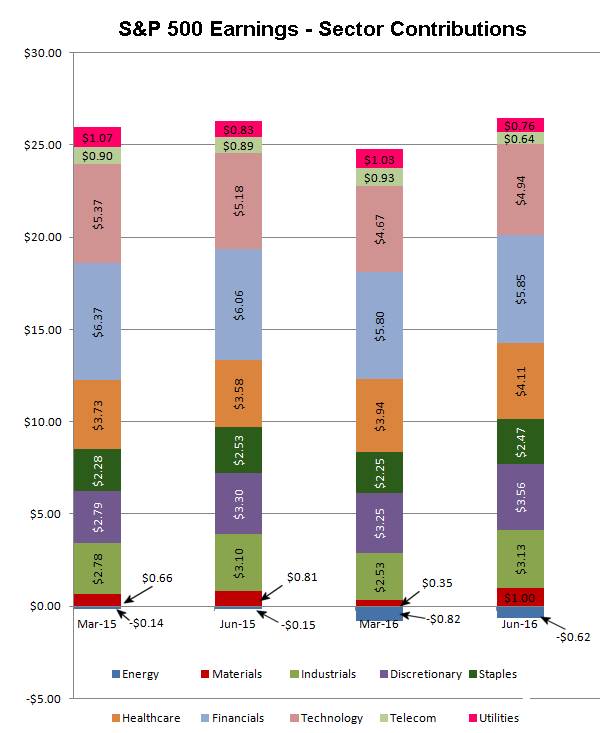
One of the persistently impressive slivers of the market is the consumer discretionary sector (XLY); its contribution to the market's overall earnings was up 8%. It was one of only four sectors that chipped in more for Q2's total bottom line. Materials was one of the four, as were the industrials (XLI) (and the industrials were a "just barely" situation). The healthcare (XLV) sector's contribution to the S&P 500's total bottom line was up a healthy 14.8%.
The takeaway? The energy sector continues to be a drag on the overall market's bottom line. There was a point in time not too long ago the sector was capable of adding between $2.00 and $3.00 to the S&P 500's quarterly profits, which have been rolling in right around the mid-$20's. [Last quarter's earnings for the S&P 500 index were $25.86.] If those profits were back in the mix and the index was earning something on the order of $28.36, the S&P 500's trailing P/E would peel back from a frothy 21 to a more palatable 19-ish. It's still high, but not uncomfortably so.
Even so, the rest of the sectors also need to start contributing more - they've all been lacking in terms of results. Oil companies can't fully justify these crazy P/E levels even if they do rebound in the foreseeable future.
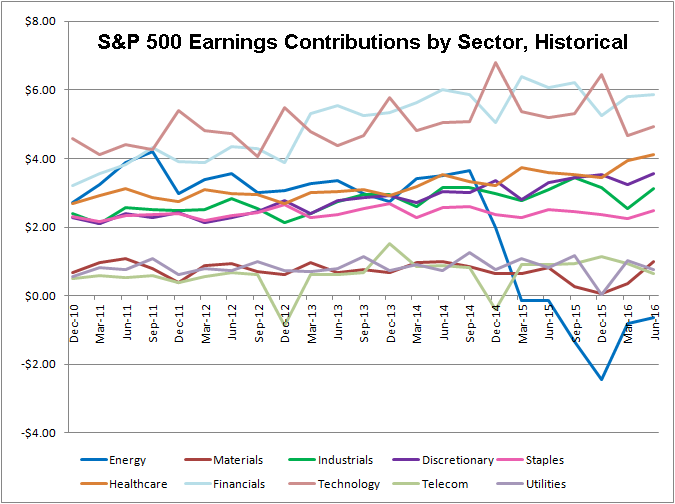
The chart below paints the more historical (though less detailed) picture of what each sector has added or subtracted to the broad market's bottom line. It's been a while since the technology (XLK) sector of financial (XLF) sector have upped the ante. Healthcare, however, has slowly been growing its contribution.