Relative Strength Index (RSI) - A Useful Charting & Trading Tool
Relative Strength Index (RSI)
The relative strength index, often abbreviated as RSI, is a straightforward technical analysis tool designed to indicate what's it name would suggest... the strength (or weakness) of a stock's or index's recent performance in relation to its average, longer-term performance. It should not be confused with a technical tool simply called relative strength, which compares a stock's or index's performance to that of another stock or index.
Technically speaking, the RSI indicator is an oscillator, plotted on a scale from 0 to 100. An RSI reading at the lower end of the scale is bearish, while a reading at the upper end of the sale - closer to 100 - is bullish. But, while mathematically it's an oscillator, Welles Wilder developed it as a tool to spot momentum, and it has been used in that capacity with as much success as it has been used as an oscillator that determines overbought and oversold conditions.
Examples of its use will best illustrate the potential value of the relative strength index to traders.
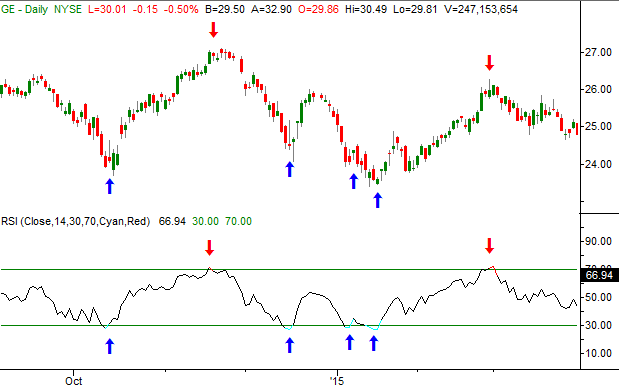
In our first example we can see the value of the relative strength indicator as a tool for spotting likely reversals. Three of the four times the RSI indicator fell below the oversold level of 30 for General Electric (GE), a trade-worthy bounce immediately followed. And, both times the RSI indicator poked above 70 - the overbought threshold - a pullback materialized.
GE Daily Chart
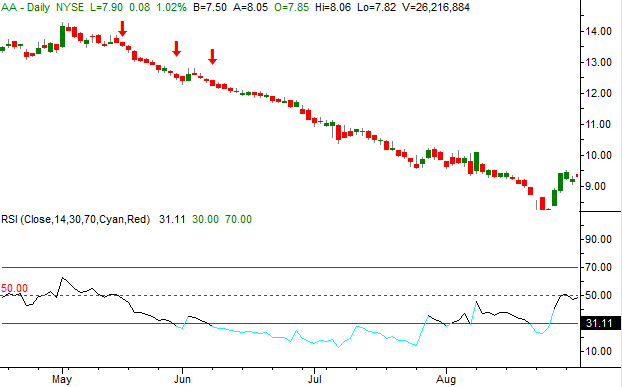
In example number two we can how the RSI indicator can be used as a momentum indicator. When Alcoa (AA) fell under the mid-point 50 level (dashed) in May, it was subtle clue that bearishness was forming. In late June with the relative strength index broke below the 30 threshold for a second time, it served as a bearish confirmation that the downtrend was getting serious. Sure enough, a prolonged downtrend followed. That downtrend remained in motion until late July when the relative strength index started to move back above the 30 "oversold" threshold.
AA Daily Chart
These examples illustrate the potential of the RSI tool, but also the key flaw in it - how does in differentiate between a chart that's ready to reverse course and a chart that's just starting a trade-worthy trend? It's a question that's often answer by the use of other, confirming technical analysis tools.
The relative strength plot is calculated as:
RSI = 100 - 100/(1 + (average of x days up closes /average of x days down closes))
The RSI indicator can be made more or less sensitive by lengthening or shortening the number of days, or bars, used in the calculation. Likewise, though the 30 and 70 levels are generally used as the oversold and overbought thresholds, they too can be tweaked to suit a trader.