Low VIX Doesn't Mean The Market Will Head Lower
Don't Fear the Eerie Calm in U.S. Stocks
by Nir Kaissar
There’s a strange disconnect today between some investors’ trepidation about U.S. stocks and the soothing signals coming from the equity market.
As my Bloomberg colleague Barry Ritholtz recently noted, a whole bunch of high-profile money mavens -- Stan Druckenmiller, George Soros and Bill Gross included -- are kvetching about the dangers lurking in U.S. shares (among other places).
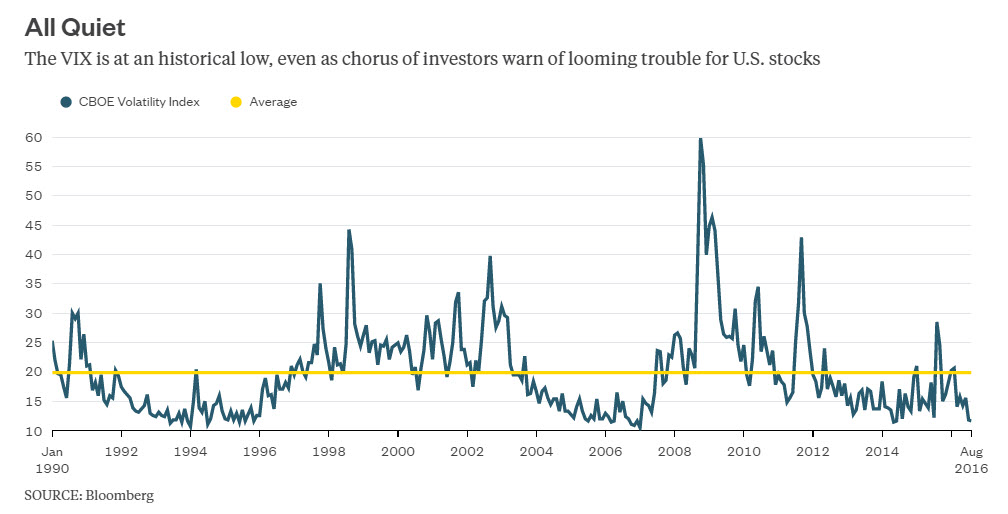
What’s odd about all this hand wringing is that, by one measure, U.S. stock volatility is at an historic low. The CBOE Volatility Index (VIX) (VXX)– a widely followed proxy for implied risk in U.S. equities better known as the VIX – closed at 11.68 on Thursday. (The lower the VIX, the lower the implied risk, and vice versa.)
To put this in perspective, the average value of the VIX has been 19.8 since 1990 (the longest period for which data is available), with a standard deviation of 7.9. Those numbers imply that 84 percent of the time, the index will be higher than 11.9, which would make its current level a rare sight. And in fact, the VIX has only been this low or lower 7 percent of the time since 1990.
If the dissonance between investors’ fears and the calm presently reigning over U.S. stocks isn’t enough, then consider that hedge funds are now betting that the VIX will go even lower. Yes, despite the fact that the index is already on the proverbial floor.
These wildly divergent – and even extreme – outlooks on U.S. stocks made me wonder: What actually happened on prior occasions when the VIX was this low?
I looked at month-end data for the VIX since 1990 and found that it has been this low or lower 31 times. A year after those occasions, the VIX was down just 16 percent of the time, and the average decline was 5 percent. The other 84 percent of the time the VIX was higher, and the average gain was 42 percent.
That’s not encouraging for hedgies who are betting that volatility will decline further from here.
I then looked at what happened to the S&P 500 (SPX) (SPY) on those same 31 occasions. The benchmark was down one year later just one time, declining 2.3 percent for the year on a total-return basis. The other 30 times the S&P 500 was up one year later, with an average return of 12.6 percent.
Longer-term results for the S&P 500 were similar. Again, on those same 31 occasions, the S&P 500’s subsequent five-year annual returns were in the red just 19 percent of the time, and the average five-year return was a negative 0.5 percent annually. Returns were positive the other 81 percent of the time, with an average five-year gain of 15.4 percent annually.
That might offer some encouragement to investors bracing for market upheaval.
So if history is any guide, then investors have it all wrong. The VIX is much more likely to move higher than lower from current levels. And just because the VIX moves higher, that doesn’t necessarily mean U.S. stocks will fall apart.
Courtesy of bloomberg.com