Earnings Surprise Amount Largest Since 2011, Likely Due To Analyst Estimates Lowered Most Since 2009
Earnings Surprise Amount Largest Since 2011, Likely Due To Analyst Estimates Lowered Most Since 2009
Why Are Q1 Earnings for the S&P 500 Now Up Year-Over-Year?
Large Upside Earnings Surprises vs. Lowered Estimates for the S&P 500
by John Butters
The blended (combines actual results for companies that have reported and estimated results for companies yet to report) earnings growth for the S&P 500 increased to 0.1% this past week, which is above the year-over-year decline of 0.4% at the end of last week and the estimated year-over-year decline of 4.7% at the end of the first quarter (March 31). This week marks the first time since January in which earnings for the first quarter reflect a year-over-year increase.
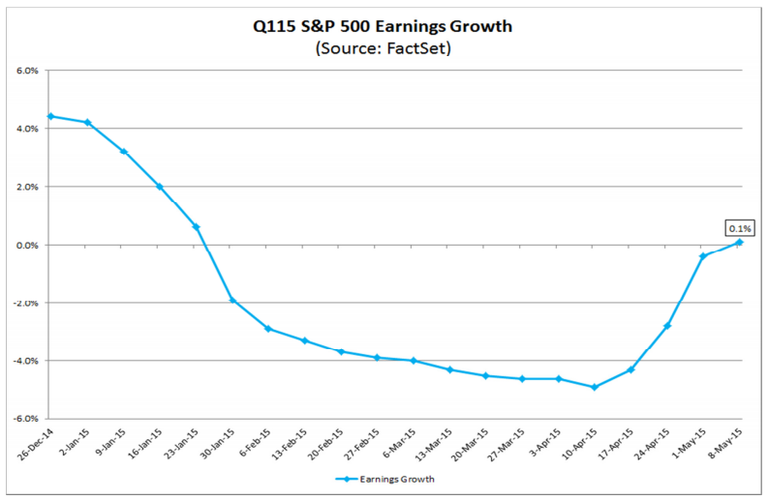
The 4.8 percentage point improvement in the earnings growth rate (to 0.1% from -4.7%) since March 31 is above the five-year average improvement in growth of 3.1 percentage points during a typical earnings season. What is behind the above average increase in the earnings growth rate for the first quarter during this earnings season?
Two factors typically drive the improvement in the earnings growth rate during an average earnings season: the number (or percentage) of companies that report earnings above estimates and the aggregate amount by which companies report earnings above (or below) estimates.
When companies in the S&P 500 report actual earnings above estimates during an earnings season, the overall earnings growth rate for the index increases because the higher actual EPS numbers replace the lower estimated EPS numbers in the calculation of the growth rate. For example, if a company is projected to report EPS of $1.05 compared to year-ago EPS of $1.00, the company is projected to report earnings growth of 5%. If the company reports actual EPS of $1.10 (a 4.8% upside earnings surprise compared to the estimate), the actual earnings growth for the company for the quarter is now 10%, five percentage points above the estimated growth rate (10% - 5% = 5%).
For Q1 to date, the percentage of companies reporting earnings above estimates (71%) is slightly below the five-year average (73%). Thus, the percentage of companies reporting earnings above estimates is not the main cause of the above average increase in the earnings growth rate since March 31, as this percentage is actually below the five-year average.
However, the aggregate amount by which companies are reporting earnings above estimates for Q1 (6.4%) is well above the five-year average (5.4%). In fact, if 6.4% is the final surprise percentage for the quarter, it will mark the highest surprise percentage for a quarter since Q1 2011 (7.0%). Thus, the above average surprise percentage for Q1 is the main driver of the above average increase in the Q1 earnings growth rate since March 31.
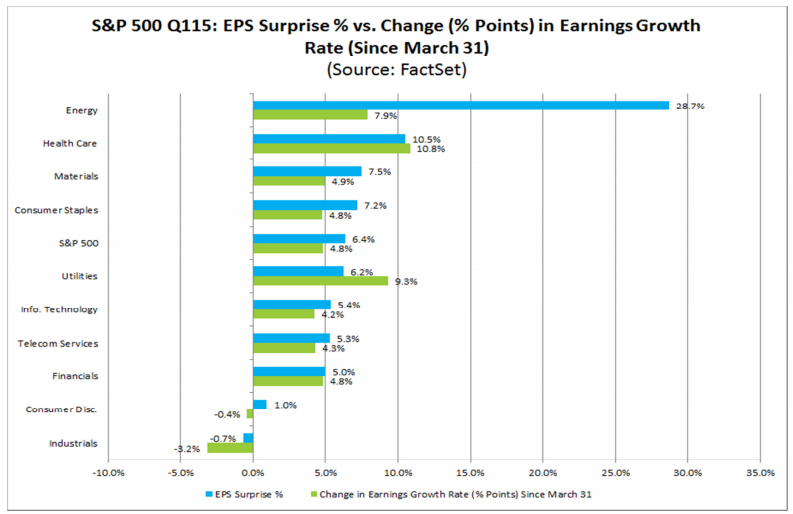
The impact of the high surprise percentage on earnings growth rates can be seen at the sector level. The sectors that have reported the largest surprise percentages of all ten sectors to date have also recorded the highest increases in their earnings growth rates since March 31 of all 10 sectors.
The Energy sector (XLE) has recorded the largest surprise percentage to date at 28.7%. Since March 31, the Energy sector has also witnessed the third highest percentage point improvement in earnings growth at 7.9 percentage points (to -56.6% from -64.5%).
The Health Care sector (XLV) has recorded the second largest surprise percentage to date at 10.5%. Since March 31, the Health Care sector has also witnessed the highest percentage point improvement in earnings growth at 10.8 percentage points (to 22.3% from 11.5%).
The Materials sector (XLB) has recorded the third largest surprise percentage to date at 7.5%. Since March 31, the Materials sector has also witnessed the fourth highest percentage point improvement in earnings growth at 4.9 percentage points (to -1.2% from -6.1%).
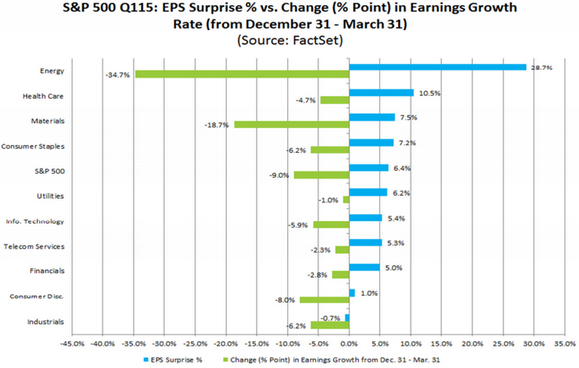
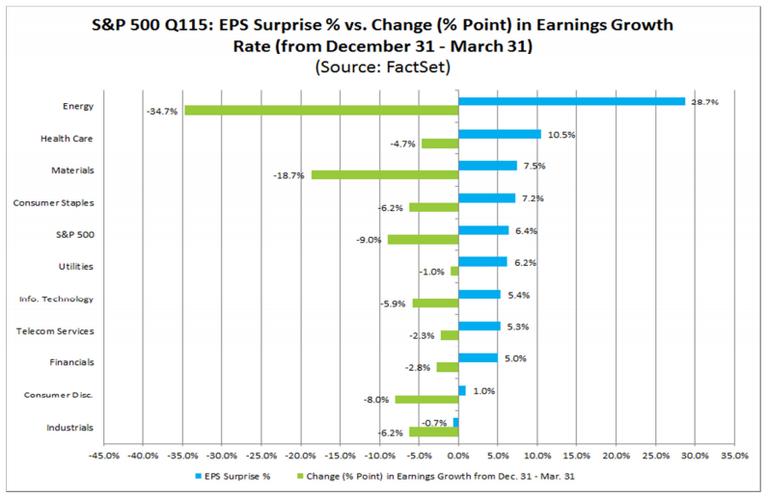
The chart below compares the surprise percentage for each sector with the percentage point change in earnings growth since March 31.
The earnings surprise percentage (which reflects the aggregate amount by which companies are reporting actual earnings above estimated earnings) for Q1 stands at 6.4%, which is well above the five-year average (5.4%). In fact, if 6.5% is the final surprise percentage for the quarter, it will mark the highest surprise percentage for a quarter since Q1 2011 (7.0%).
However, are companies reporting large upside earnings surprises for Q1 in part because analysts lowered estimates by larger than average margins during the first quarter?
The answer is yes. During the first quarter (from December 31 to March 31), analysts lowered earnings estimates for S&P 500 companies in aggregate by 8.2% for the first quarter. This 8.2% decline was the largest decrease in the estimated earnings for a quarter since Q1 2009. As a result of these large cuts to earnings estimates, the estimated earnings growth rate for the first quarter dropped by 9.0 percentage points (to -4.7% from 4.3%) during the quarter. This was the largest percentage point decline in the earnings growth rate for a quarter for the index since Q1 2009.
At the sector level, the Energy sector has reported the highest earnings surprise percentage to date of all ten sectors at 28.7%. During the first quarter, analysts lowered earnings estimates for companies in the Energy sector in aggregate by 50.3% for the first quarter. This was the largest decline in expected earnings for the Energy sector for a quarter since FactSet began tracking the data in 2002. As a result of these large cuts to estimates, the estimated earnings decline for the Energy sector increased by 34.7 percentage points (to -64.5% from -29.7%) over this period. This was the largest negative percentage point change in terms of earnings growth of all 10 sectors. In fact, the Energy sector accounted for almost half of the decrease in the expected earnings growth rate for the entire S&P 500 during Q1.
Courtesy of Factset Insight