Can The Market Overcome Troubling Calendar Trends?
The Calendar Versus The Trend
There is no denying that the bulls have been on a roll of late. The S&P 500 (SPX) (SPY) has gained 9% since the post-BREXIT low seen on June 27 (the last time the pouting pundits were absolutely, positively sure that the next great calamity in the markets had begun) and has advanced 19.3% from the February 11 low.
Along the way, the market has produced several "breadth thrust" buy signals, which, while easier to come by in the high-speed trading era, have continued to be profitable 3-, 6-, 9-, and 12-months after the signals. In addition, Ned Davis Research tells us that a new cyclical bull market is underway.
I'd also like to point out on this fine Wednesday morning that the last nagging indicator group that I follow daily finally turned green this week. I'm talking about the set of models that determine whether the stock market is trading in a mean-reverting mode or trending in one direction or the other.
The bottom line here is that until this week, the indicators suggested that the market had been classified as being in a mean-reverting mode for much of the past two years. Thus, it was encouraging to see that first our Efficiency Ratio model (a model that determines how "efficient" a move in the market is) and then our Strength of Trend model both flipped to the "Trending" mode this week.
So, while there is also no denying that (a) stocks have become overbought from both a short- and intermediate-term perspective and (b) that the bears may find a raison d'etre at any point in time here, I think one has to remain upbeat about the outlook for stocks when looking out over the next year.
But...
It is also fair to note that the calendar is about to turn ugly as far as the historical patterns in the stock market are concerned. Although October may be the month that has contained the most stock market crashes, September has historically been quite volatile. And don't look now fans, but September isn't that far away.
In fact, our cycle composite, which is comprised of the 1-year seasonal cycle, the 4-year Presidential cycle, and the 10-year decennial cycle, peaks at the beginning of next week. And I'm sorry to report that the cycle then points to a steady downtrend through early October. Ughh.
So, there you have it. The trend may indeed be an investor's best friend from a longer-term perspective. But at the same time, things could easily get very sloppy and perhaps even a little scary in the near-term.
What's an investor to do with this situation, you ask? The answer is simple. Think longer-term. Don't freak out when stocks start to pull back or buy into the doom and gloom that will undoubtedly be espoused from the bear camp over the next two months. And finally, make a plan to use the anticipated decline to your advantage by, yep, that's right, buying the dip.
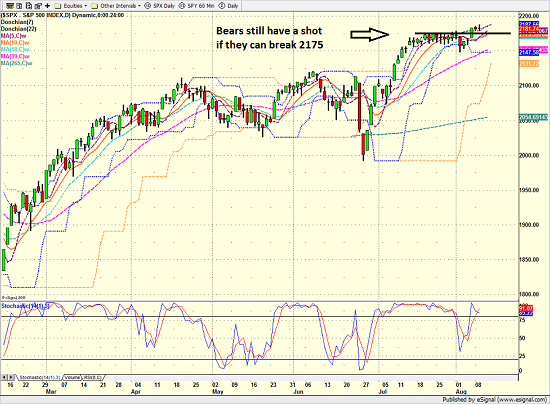
From a near-term technical standpoint, stocks are clearly overbought and the rally has stalled. Thus, it will be a game of key levels from here. The bears will first target the 2175 level as a way of announcing that it's their turn to run with the ball. Then the 2145 will become critical.
S&P 500 - Daily Chart
So, while things look positive from a longer-term perspective, it looks like it could be anybody's ball game in the near-term.
Current Market Drivers
We strive to identify the driving forces behind the market action on a daily basis. The thinking is that if we can both identify and understand why stocks are doing what they are doing on a short-term basis; we are not likely to be surprised/blind-sided by a big move. Listed below are what we believe to be the driving forces of the current market (Listed in order of importance).
1. The State of Global Central Bank Policies
2. The State of the Earnings Season
3. The State of Oil Prices
4. The State of U.S. Economic Growth
Courtesy of talkmarkets.com