Weekly Market Outlook – The Rally’s Renewal is 0% Surprising

For a couple of weeks it looked like the market might finally succumb to the weight of its recent gains. But, the bulls were able to put the rally back in gear before it completely stalled. The S&P 500 advanced 2.3% last week, reaching another record high in the process.
In short, the rally is still alive. Better still, the way it’s advancing suggests the effort can be sustained… as unlikely as it seems like that should be. The indexes are very much in a bullish “groove.”
We’ll look at the nature of the gains in a moment. Let’s first look at last week’s major economic news and then preview what’s on the schedule for this week.
Economic Data Analysis
Last week’s biggie of course was the decision on interest rates. As was widely expected, the Federal Reserve opted to not lower the Fed Funds Rate this time around after all. Inflation is still above-target, and the economy is doing reasonably well. (Q4’s GDP growth rate is somewhere in the ballpark of 3.2%.)
Underscoring this persistent strength, for one, is last week’s housing real estate data. Housing starts as well as building permits were both up, and by more than expected. It’s still a bit too soon to say the new-home construction market is firing on all cylinders, but it’s not a stretch to suggest things could be on the mend.
Housing Starts and Building Permits Charts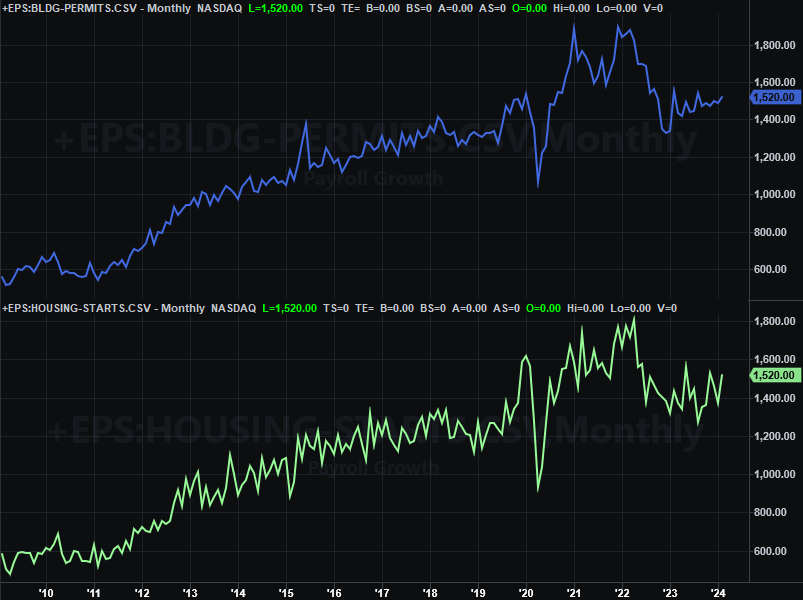
Source: Census Bureau, TradeStation
In this vein, know that the homebuilder confidence index improved again in February. That’s the fourth straight month of gains, carrying the index to the highest level it’s been at since July of last year.
New home sales for February won’t be reported until next week, but we did hear about last month’s existing home sales this past week. They were well up too, easily topping expectations. This data bolsters the argument that the real estate market may finally be on the mend.
New, Existing Home Sales Charts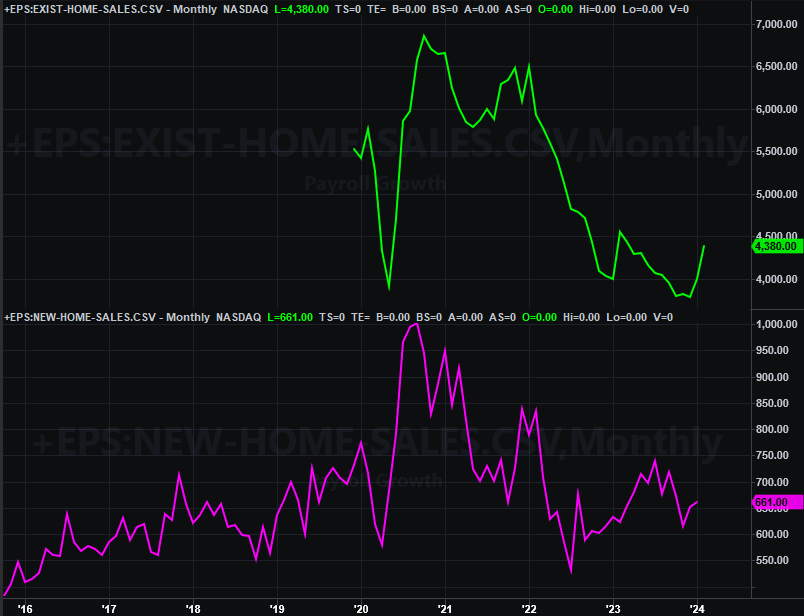
Source: Census Bureau, National Assn. of Realtors TradeStation
Everything else is on the grid.
Economic Calendar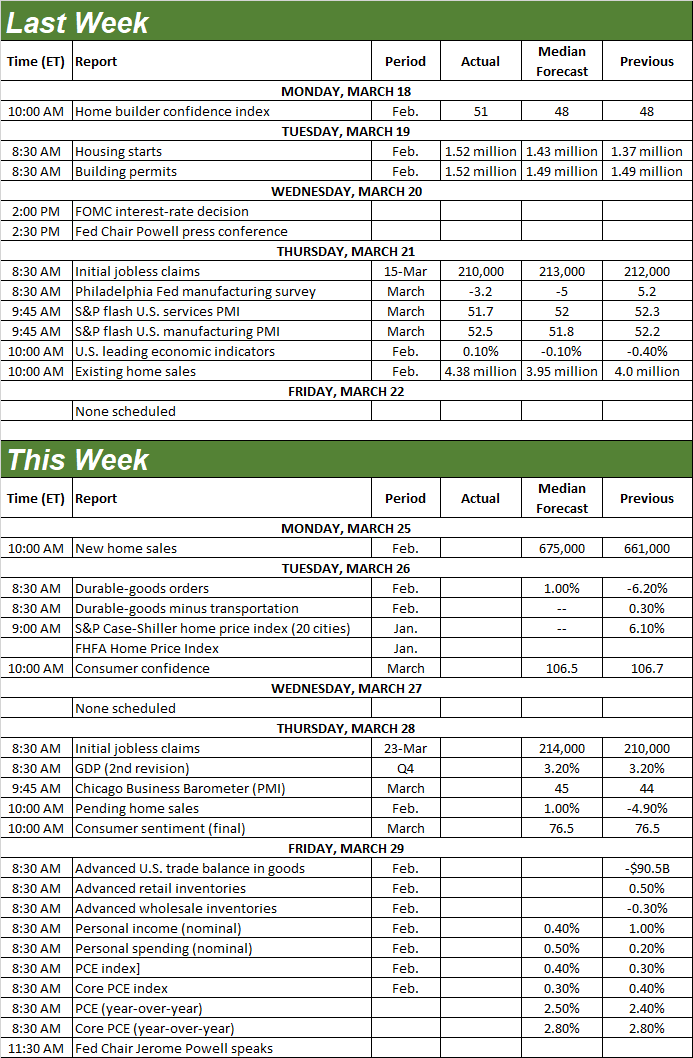
Source: Briefing.com
In addition to Monday’s new-home sales report, this week is a big one for real estate for yet-another reason. That is, on Tuesday we’ll get January’s Case-Shiller Home Price Index and the FHFA Home Price Index. You’ll notice that the long-lived wave of price increases has been slowing for a while now; the S&P Case-Shiller Index has even been in decline since late last year.
Home Price Index Charts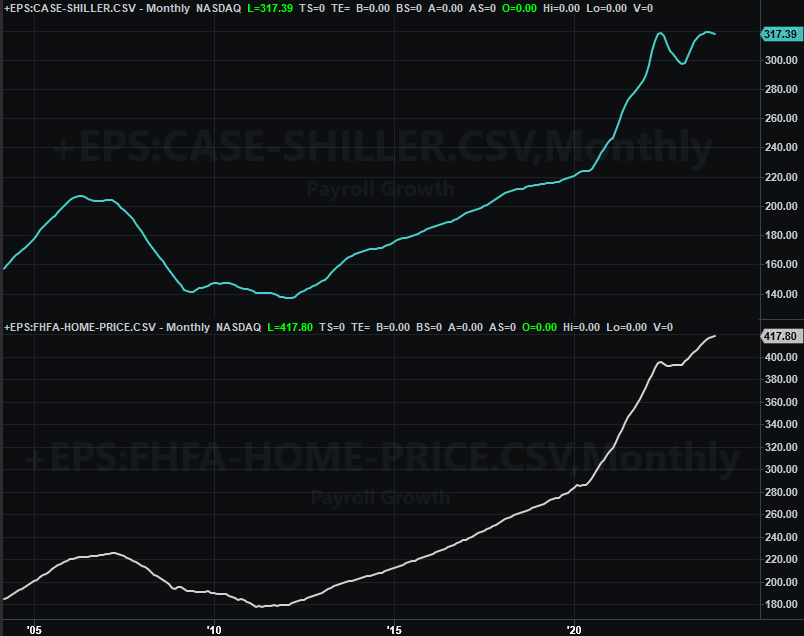
Source: FHFA, Standard & Poor’s, TradeStation
This isn’t necessarily bad thing. That is to say, lower home prices might be more of a good thing than a bad thing by virtue of making homes at least a little more affordable, thereby spurring the buying and selling of many more homes than has been happening of late. The uptick in existing home sales figures already suggests this tailwind may be blowing. At this point, seeing the “lesser of two evils” taking shape is a relative victory.
Look for major updates on consumer sentiment this week too (which can work hand-in-hand with real estate and homebuying). The Conference Board’s consumer confidence number for March will be posted on Tuesday, with the third and final look at the University of Michigan’s consumer sentiment score for this month due on Thursday. The University of Michigan’s reading has perked up quite a bit of late. The Conference Board’s hasn’t. It’ll be interesting to see what -- if anything -- changes this time round.
Consumer Sentiment Charts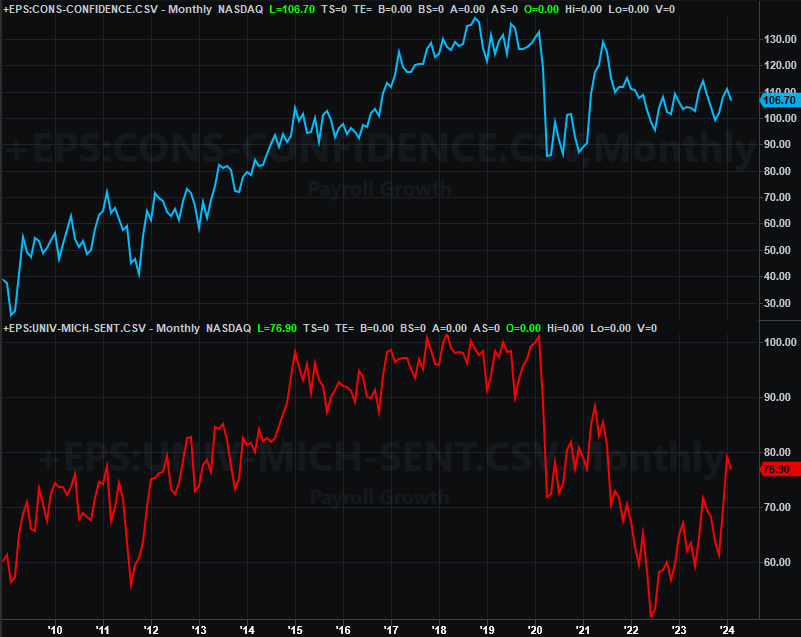
Source: University of Michigan, Conference Board, TradeStation
Finally, although we’re not charting it here, know that we’ll hear last month’s consumer spending and income figures on Friday. These are the data nuggets the Federal Reserve actually pays the most attention to when it comes to making decisions regarding interest rates. That said, know that both outlays and income continue to hold at levels that support sustained inflation, and are expected to continue doing so this time around. The Fed’s got every reason to hold off on cutting interest rates.
Stock Market Index Analysis
A week ago the market was on the verge of a fairly serious breakdown. Stocks have rallied quite a bit from October’s low, and the weight of the gains is starting to be felt. But, the narrow trading range that’s framed the rally since the beginning of this year is stronger than the bear’s willingness to push the market over the edge.
The framework of this idea is readily evident on the daily chart of the NASDAQ Composite. The technical floor (light blue, dashed) that’s been steering the index higher since its early-January low only needed to be touched a week ago -- and again on Tuiesday of last week -- to renew the rally.
NASDAQ Composite Daily Chart, with VXN and Volume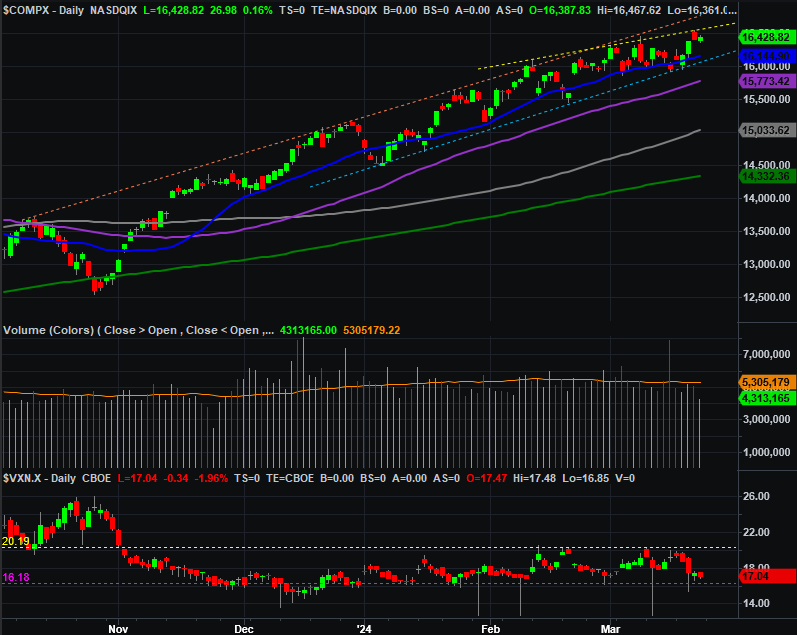
Source: TradeNavigator
Granted, the rally also stopped once it encountered the upper boundary of the rally going all the way back to October (orange, dashed). In fact, it didn’t even get that far. A new, shallower technical ceiling (yellow, dashed) seems to be capping the NASDAQ’s advances now. Even so, the advance is well-framed, and its guardrails are well-proven.
Here’s the weekly chart of the NASDAQ Composite for a little more perspective. The prior couple of weeks were challenging, but the bulls got back on their proverbial horse last week to ride the index to new record.
NASDAQ Composite Weekly Chart, with VXN and Volume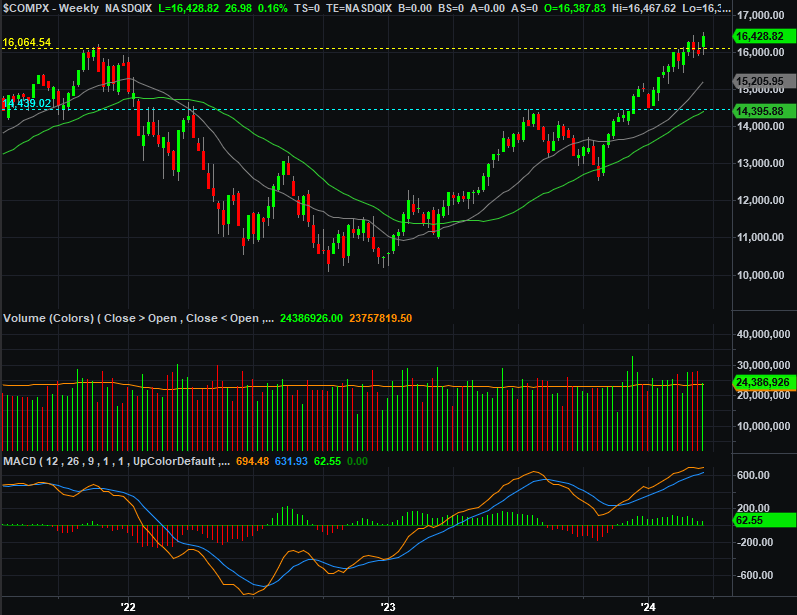
Source: TradeNavigator
That’s not quite the case for the S&P 500. It’s got well-defined and well-proven technical ceilings and support in place as well, and its rally last week didn’t stop until the very upper edge of the trading range in place since October was hit (light blue, dashed). You’ll also see the S&P 500’s 20-day moving average line (blue, solid) continues to serve as a tough, resilient support level.
S&P 500 Daily Chart, with VIX and Volume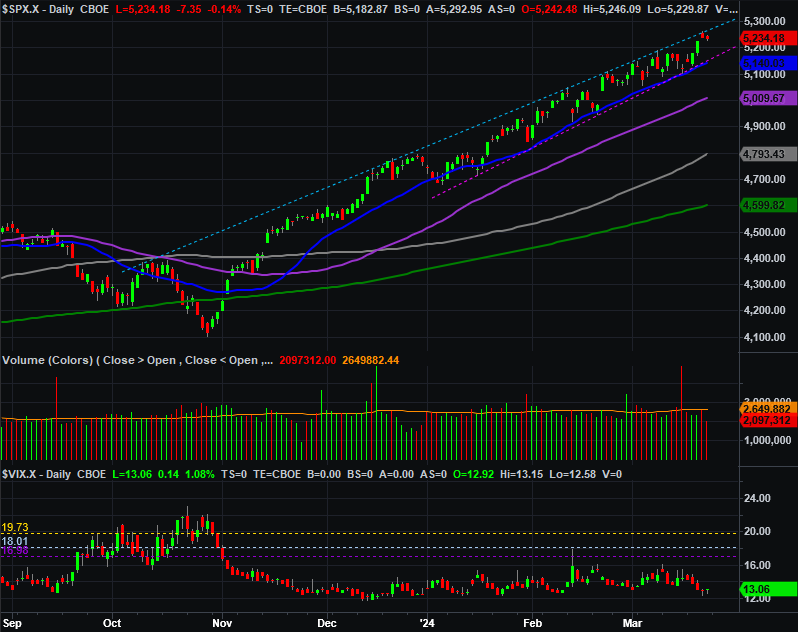
Source: TradeNavigator
The weekly chart of the S&P 500 doesn’t show us anything else, other than to remind us that this breakout is still ultimately the result of a successful cup-and-handle pattern that was completed -- bullishly -- with December’s breakout above the brim line around 4,600. If this cup-and-handle breakout is like the usual one, the rally should extend all the way to the 5,600 area. (That’s based on the height of the cup itself).
S&P 500 Weekly Chart, with VIX and Volume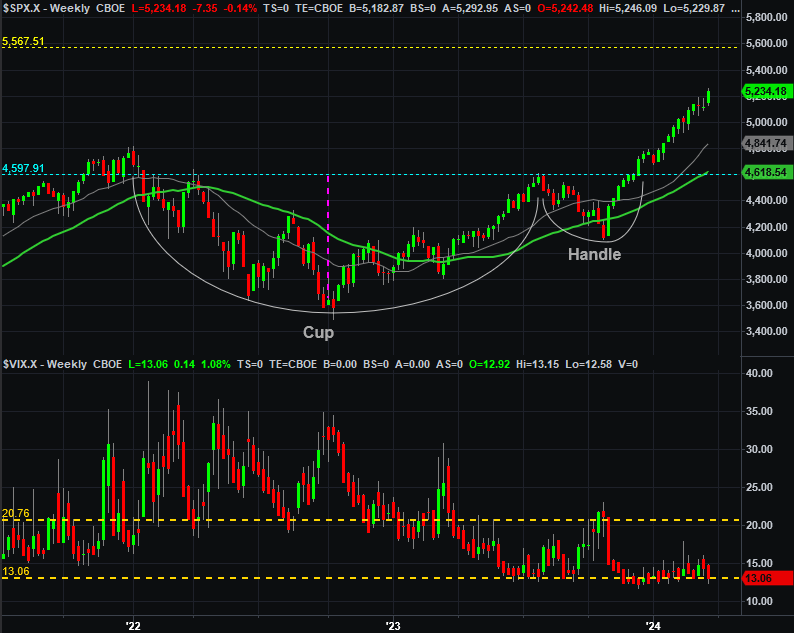
Source: TradeNavigator
That being said, don’t place too much blind faith in the idea that a cup-and-handle breakout has to span the exact same distance as the cup’s peak to trough. Sometimes it does. Sometimes it doesn’t. In this particular case the height of the cup is rather high, making its end-target a lofty goal. We’re also moving into a slower time of year for the market against a backdrop of economic uncertainty. This one could easily prove to be an exception to the norm… whatever the norm may be.
In other words, you’ll still want to keep an out for clues of a technical breakdown. That’s even more so the case given how low both of the volatility indices have gotten again. Fortunately, both of the indexes’ short-term technical floors are now very well-defined.