Weekly Market Outlook - The Rally Starts to Show Cracks
 The market, or the bulls, did everything they could to pick themselves up off the mat following Tuesday's implosion. But, it was to no avail. When all was said and done, stocks ended the worst week since October on a low note, moving in the wrong direction.
There's still one last bastion of hope. And, it's a promising one. It's up to the bulls to make the convincing argument though, and give traders enough reason for hope to keep them buying if they start to again.
We'll look at how much the market is on the fence below, and what it will take to get stocks off the fence. First, however, let's run down last week's and this week's economic numbers.
Economic Data
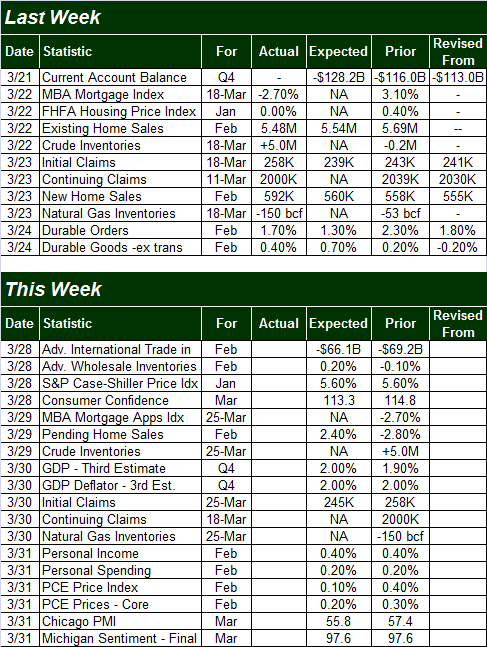
There were only a couple of data sets of any interest last week... home sales, and durable good orders. Both were more encouraging than not.
Though the pace of existing homes sales fell from 5.69 million to 5.48 million in February, the broad trend there is still upward. And, the lull in existing home sales was offset by the sizeable jump in new home sales. The pace of new home sales grew from 558,000 to 592,000... an advance that's also part of a respectable uptrend. There continues to be an odd lack of inventory, perhaps keep prices firm, but also perhaps holding purchases back.
Housing Starts and Building Permits Charts
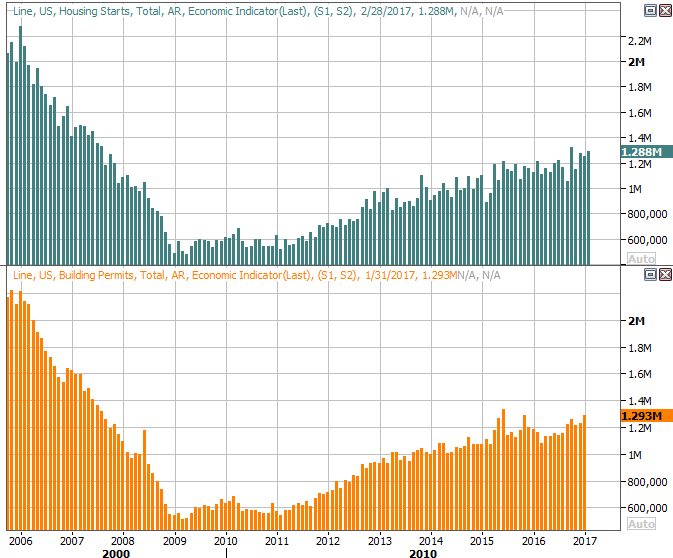
Source: Thomson Reuters
Orders for durable goods were up too, with or without transportation orders. More important, orders have been growing persistently -- even if slowly -- for several months now.
Durable Goods Orders Charts
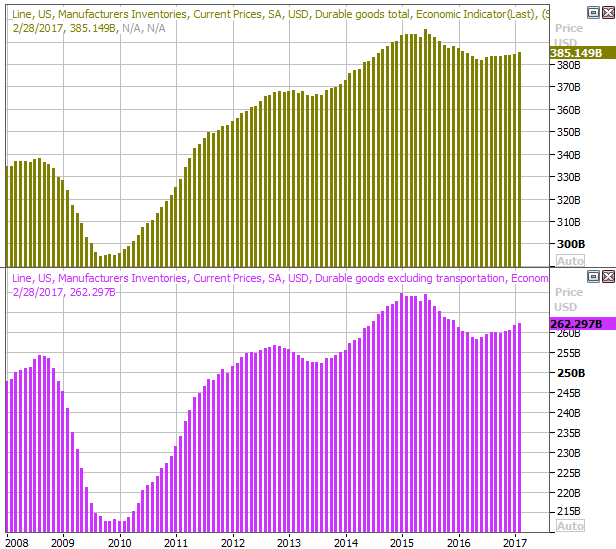
Source: Thomson Reuters
Though we're not seeing strength on all economic fronts, last week's data was plenty positive. Everything else is on the grid.
Economic Calendar
Source: Briefing.com
This week is going to be busier, though not much of the data in the queue is earth-shattering. The only items of real interest the update on consumer sentiment levels, and Q4's final GDP reading.
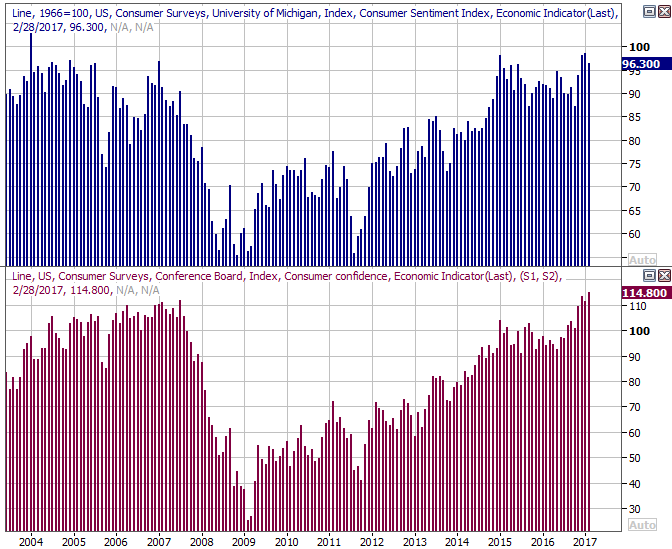
Sentiment-wise, the Conference Board's consumer confidence level is expected to peel back a little, though it's still near multi-year highs. The third and final reading for March's Michigan Sentiment Index is expected to roll in at the same level as the second reading, In both cases the trend remains a bullish one, though it's noteworthy that confidence is right where it was in 2005... right before those consumers paid the price for being overconfident. We'll see if that ends up being a red flag soon (or not soon).
Consumer Sentiment Charts
Source: Thomson Reuters
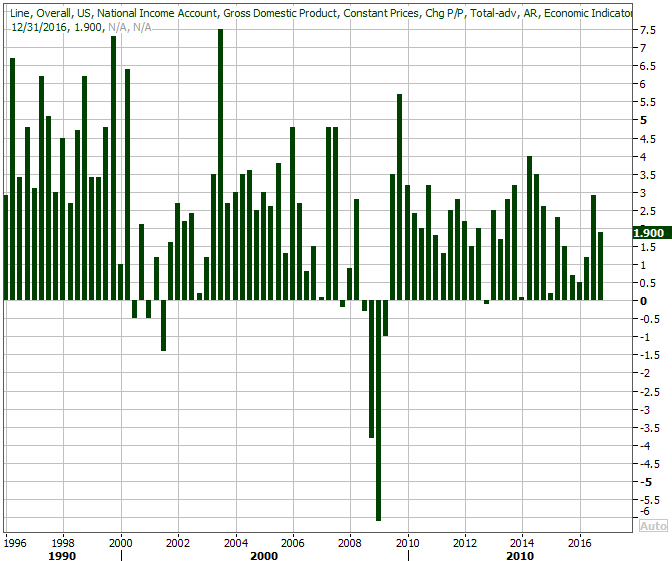
Finally, economists have cranked up their previous Q4 GDP growth estimates from 1.9% to 2.0%. By this time, they've got a pretty good idea of how things are taking shape, so don't look for any wide deviation from the outlook. That 2.0% growth isn't bad, but it's still not enough to meaningfully move the dial on earnings or employment growth. We need to see GDP growth persist above 3.0% for the economy to achieve escape velocity.
GDP Growth Charts
Source: Thomson Reuters
Index Analysis
Though Tuesday's drubbing was painful and pulled the market under some critical technical support, a bastion of hope remained. With the market unable to break back above that key floor by the time Friday's closing bell rang though, traders are forced to digest the distinct possibility that we may finally be starting an overdue correction. We're still not quite past the tipping point yet, however.
The daily chart of the S&P 500 below illustrates the story well enough. The index broke under a key support level at 2353 on Tuesday, and despite trying on Thursday and Friday, couldn't get back above that mark. In fact, it looks like the former floor at 2353 has since become a ceiling.
S&P 500 Daily Chart
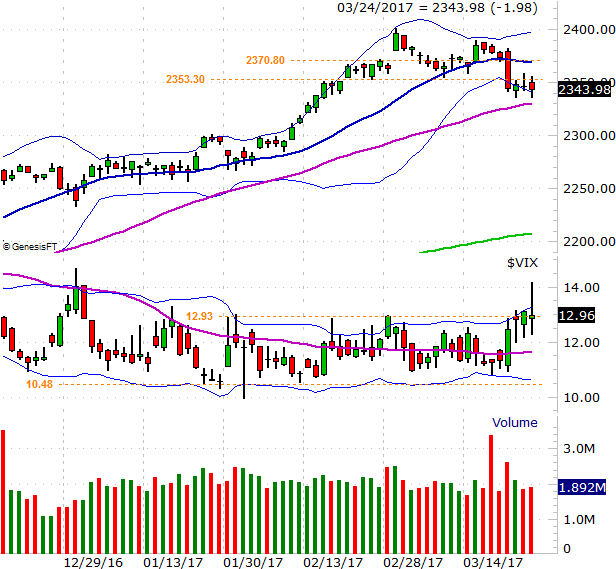
Chart created with TradeStation
At this point, the 50-day moving average line (purple) at 2328 is the make-or-break level. That is to say, there are still enough bulls who are believers to keep the market in position for a rebound. Should the market slide just a little bit further south though, another swath of those bulls are apt to throw in the towel, pushing the market past the tipping point. Indeed, until the S&P 500 manages to make its way above the 20-day line (blue) at 2372, we can't really get bullish again.
With all of that being said, perhaps the most interesting and the most helpful clue on the daily chart of the S&P 500 right now isn't the S&P 500 itself, but the VIX. For the first time in weeks it's making some real moves above 12.9. Moreover, it's starting to trend higher.... also for the first time in a while.
Granted, Friday's doji bar for the VIX hints of a reversal out of an uptrend and back into a downtrend, which is bullish for stocks. It's a little too soon to be making such an assumption though. As was noted previously, starting a new trend is more of a process and less of an event. The bulls may have to be beaten up again a couple more times before they become convinced their cause is lost.
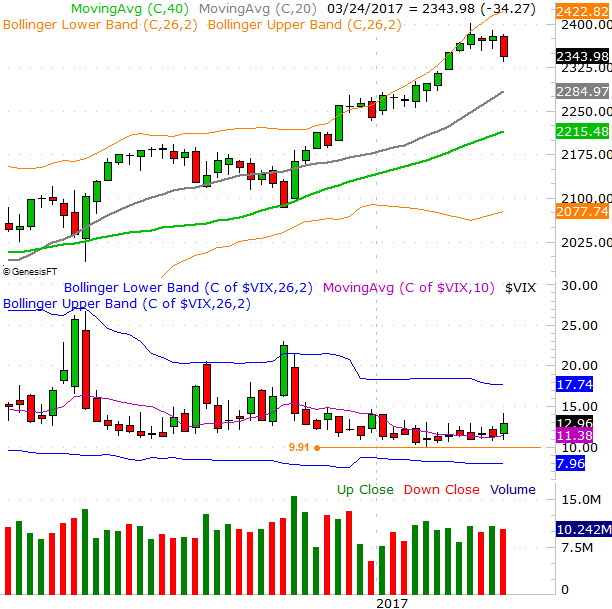
The weekly chart of the S&P 500 doesn't tell us anything about the current situation that we can't tell from the daily chart. But, for whatever reason, a look at the weekly chart does put everything in perspective. The size of the bearish candle from the S&P 500 and the size of the bullish candle are star, and in both cases clearly alter the direction of the trend for both.
S&P 500 Weekly Chart
Chart created with TradeStation
It's on this chart we can get a feel for how overextended the market got, and how big the correction could be. The S&P 500's 200-day moving average line (green) is a proven floor, and the VIX's ultimate ceiling is its upper 26-week Bollinger band at 17.7. There's obviously no guarantee a corrective move is in the works, but the question is, what's to realistically prevent it from happening?