Weekly Market Outlook - The Bulls Just Went "All In"

The market didn't exactly get last week started on the right foot, but it certainly ended the week on a high note. Spurred by renewed hopes that tax reform would get done this year after all, the S&P 500 pushed its way to close of 2575.21 on Friday. That's up 0.7% from the prior week's close, but an impressive 1.1% bullish swing just from Thursday's low of 2547.92.
Technically speaking, it's a breakout thrust from an already-bullish trend. In that we're trend followers, we have to take the move at face value and presume more of the same is in the cards. On the other hand, it would be naive not to acknowledge there's something very uncomfortable about a market that ignores any and all risks for this long.
We'll weigh both arguments below, after a run-down of last week's and this week's economic news.
Economic Data
Last week wasn't terribly busy in terms of economic news to sift through, but we did get three big items, two of which help us gauge the health of the real estate and construction sector. But, first things first.
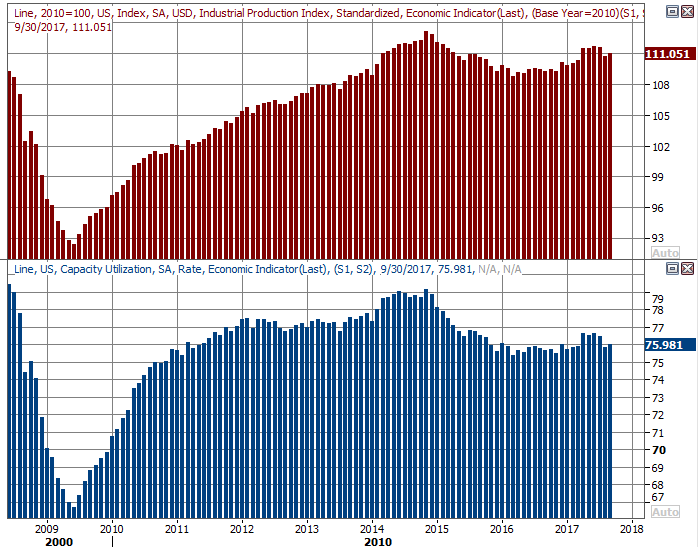
All things considered, it wouldn't have been terribly surprising if September's industrial productivity and capacity utilization were lower. Though the impact of two hurricanes was mostly felt in August, the lingering slowdown linked to the shuttering of businesses (and homes) certainly persisted through September. As it turns out though, the country regrouped rather quickly, perhaps because of the rebuilding effort. We used 76% of our total manufacturing capacity, and industrial production grew 0.3% -- versus expectations of only 0.2% growth -- reversing August's 0.78% dip. The short time it took to hammer out this rebound is encouraging.
Capacity Utilization and Industrial Productivity Charts
Source: Thomson Reuters Eikon
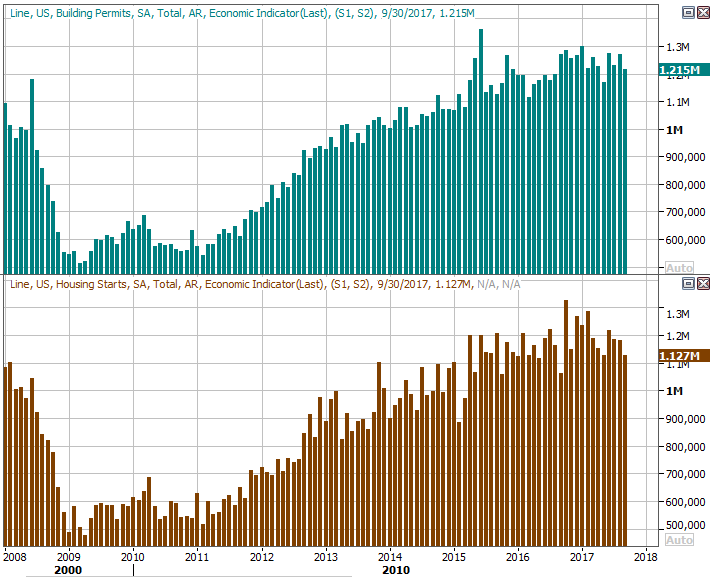
The impact of hurricanes Harvey and Irma are still lingering though, surprisingly enough holding back the number of new homes started and requested permits [one would think the destruction of many homes would boost those figures, but they didn't.]
Housing Starts and Building Permits Charts
Source: Thomson Reuters Eikon
You'll readily notice there was a slowdown even before August's plunge. To not see at least a modest bump in light of recent events doesn't bode especially well for the real estate market. The existing home sales report (see below) wasn't exactly thrilling either.
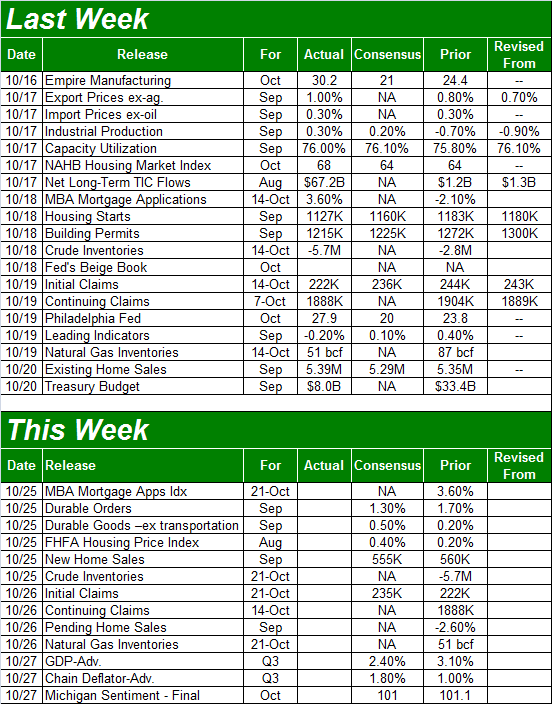
Everything else is on the grid.
Economic Calendar
Source: Briefing.com
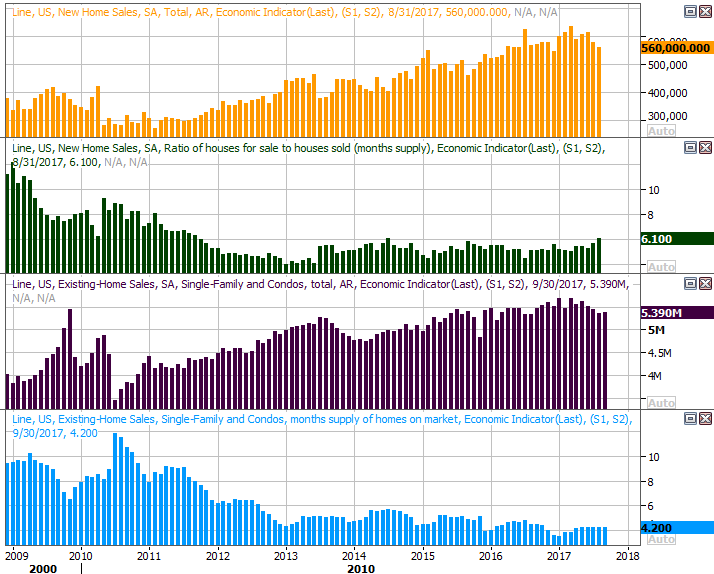
Last week's existing home sales report will be rounded out this week with September's report of new home sales. Thing is, the pros are calling for a slight dip in the pace of new home purchases, more or less corresponding with no real change in the pace of existing home sales. Not that people who've seen their homes destroyed will simply move into another one (some will, but most won't), and not that anybody's looking to buy a home in an area that's been impacted by a hurricane, but the continuation of the broad malaise here is a concern.
New and Existing Home Sales Charts
Source: Thomson Reuters Eikon
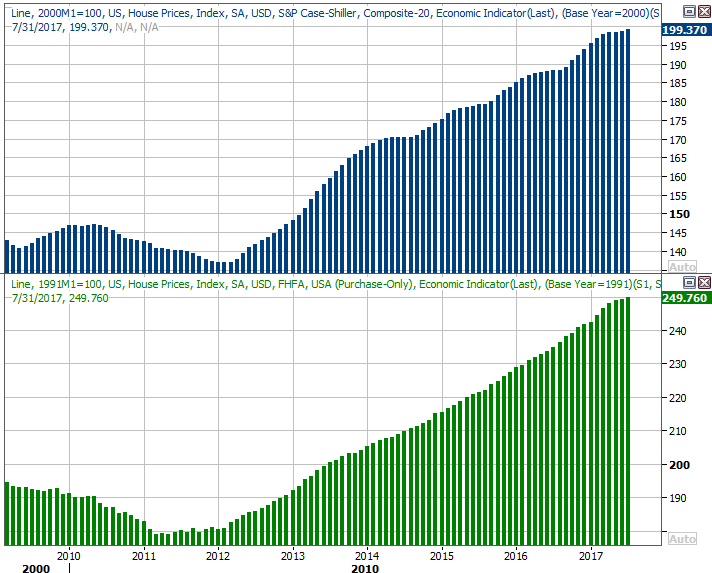
The one bright spot on the real estate front: At least home prices are still trending higher. The FHFA Housing Price Index for August (not September, but August) is projected to rise 0.4%.
FHFA and Case-Shiller Home Price Charts
Source: Thomson Reuters Eikon
We won't get the Case-Shiller Home Price Index report for August until next week, but it's on the rise as well.
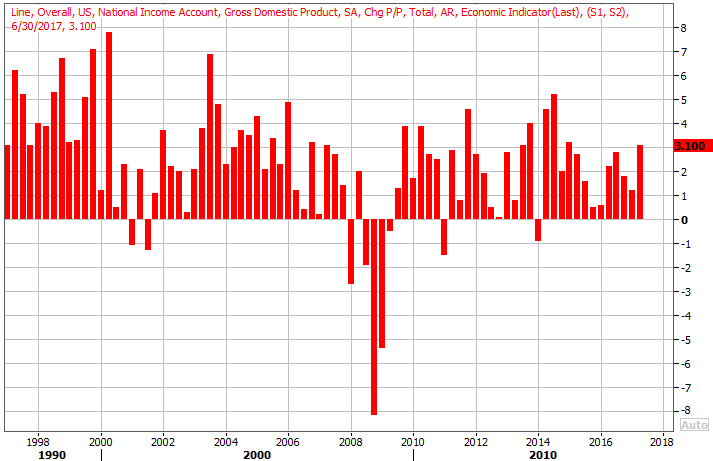
The one item everyone will have their eyes on this week, however, is the first of three readings on Q2's GDP growth rate. Economists think it's cooled from Q2's 3.1% to 2.4% this time, which is still quite good. But, as much as investors have bid the market up in anticipation of Trump-driven growth, any shortfall could have dire consequences... at least in the near-term. Perception and relativity are everything here.
GDP Growth Charts
Source: Thomson Reuters Eikon
We'll also get the third and final reading for the Michigan Sentiment Index for September this week, but we'll save that discussion for next week when we can compare and contrast it with similar consumer confidence data form the Conference board.
Index Analysis
To put it in poker parlance, the bulls just went "all in" with last week's buy-in. The bears are either going to fold, or call the bulls' bluff (if it is one). Whatever's in the cards, this is a dangerous time for stocks should the would-be profit-takers finally pull the trigger.
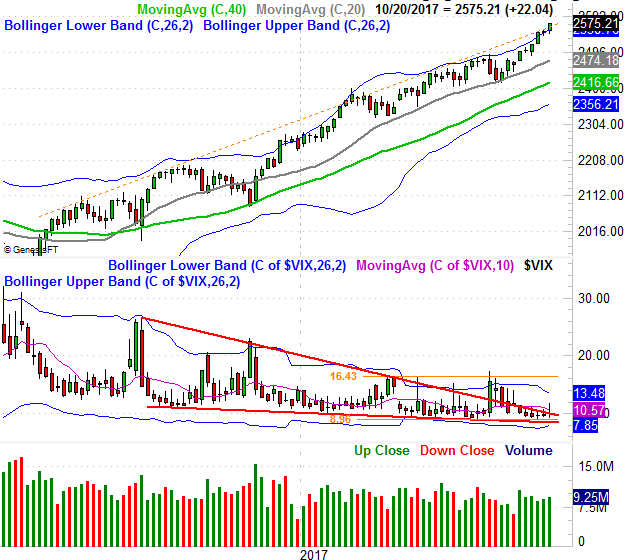
We'll start this week's analysis with a look at the weekly chart of the S&P 500, just to put things in perspective. As you can see, thanks to last week's modest shove, the index has poked above a resistance line (orange, dashed) that goes back to early 2016. Last week's 0.7% advance wasn't a show-stopper, but in the context of the 6.5% runup we've seen since late August, we're more than pushing our luck.
S&P 500 Weekly Chart
Source: TradeNavigator
Though in a superficial sense this is a hint of a breakout thrust, history isn't on the market's side here; we've gone about as far as we can go.
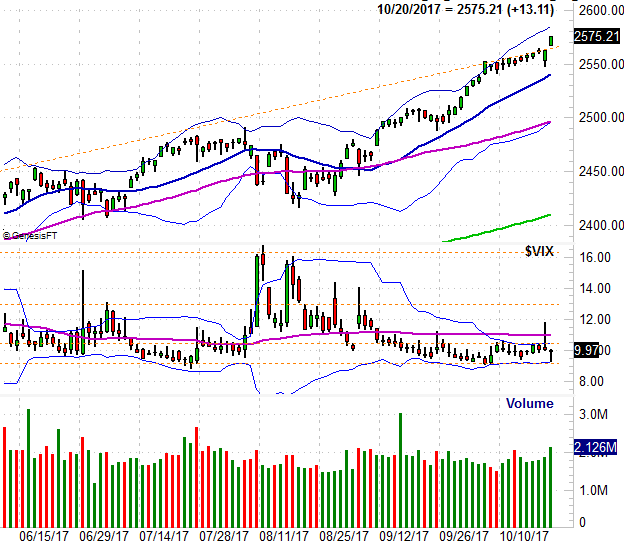
Zooming into a daily chart of the S&P 500 we can get an even better grip on the market's dynamics at this time. Note that the VIX fell back to its absolute low around 9.2, kissing its lower Bollinger band in the process. That, at least in some regards, makes it tough for stocks to climb any further. There are exceptions though. On the other hand, even if a pullback is inevitable, it may not happen right away, and it may not happen from where the index is right now. It could move even higher, bumping into the upper Bollinger band at 2585 before exhausting itself.
S&P 500 Daily Chart
Source: TradeNavigator
Still, even a small pullback doesn't inherently mean a major pullback is in the offing.... particularly as persistent as the buyers have been of late. For things to truly move from bad to worse, the S&P 500 is still going to need to fall under the 200-day moving average line (green) at 2413 and the VIX is going to have to break above its recent ceiling at 16.3 for stocks to move past the tipping point. Anything less, and we can't assume it's anything more than just the market's natural ebb and flow.
Again though, each bullish step we take moves us deeper into overbought territory, and brings us one step closer to a much-needed correction.
