Weekly Market Outlook - The Best Week In 2 Years Still Isn't Enough
And just like that, more than four weeks' worth of losses were wiped away. The S&P 500 logged a 6.1% gain last week, inspired by the bullish spin put on the Fed's rate hike (and plans for future hikes). Traders also seem to be rethinking their initial bearish expectations prompted by Russia's invasion of Ukraine. It was the best week for stocks, in fact, since early 2020 when investors rethought the impact of COVID-19's arrival in the United States.
It's curious though. The volume behind the rally was never all that thrilling, and for the S&P 500 anyway, the rally stopped right at a major technical ceiling without actually moving above it. There's a whole lot of fragile psychology in play here.
We'll look at all of it in detail below. First, however, let's recap last week's biggest economic news, and preview what's coming this week.
Economic Data Analysis
There's little doubt about the most important item from last week... the Federal Reserve's decision in interest rates. As was widely expected, the FOMC upped the targeted Fed Funds rate by a quarter of a point, looking to keep it in a range between 0.25% and 0.5%. More than that though, the Fed's governors seem to understand that proper pacing is critical. The tentative plan seems to be six more quarter point hikes thus year, which should be slow enough to not shock the economy into a recession.
Rate hikes weren't the only economic news in last week's lineup though. We also rounded out the inflation picture that the Federal Reserve is trying to temper. And, it's clear the FOMC is right in planning so many hikes this year. Producers (factories, processing plants, assemblers) are facing input costs that are 10% higher than they were a year ago. Even stripping out volatile prices for commodities and fuel, producers are facing inflation of 6.6%. Something's got to give, and soon.
Inflation Rate Charts
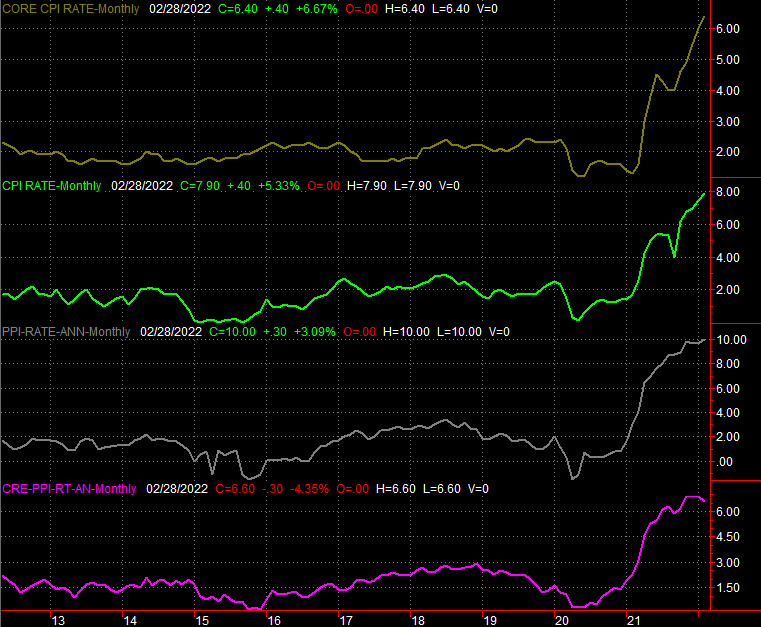
Source: Bureau of Labor Statistics, TradeStation
Despite higher prices for.... well, pretty much everything, consumers aren't terribly discouraged from spending. Retail spending grew 0.3% last month, and taking automobile sales out of the picture still led to a 0.2% increase from January's spending levels. In nearly all measures retail consumption once again moved to record levels.
Retail Sales Charts
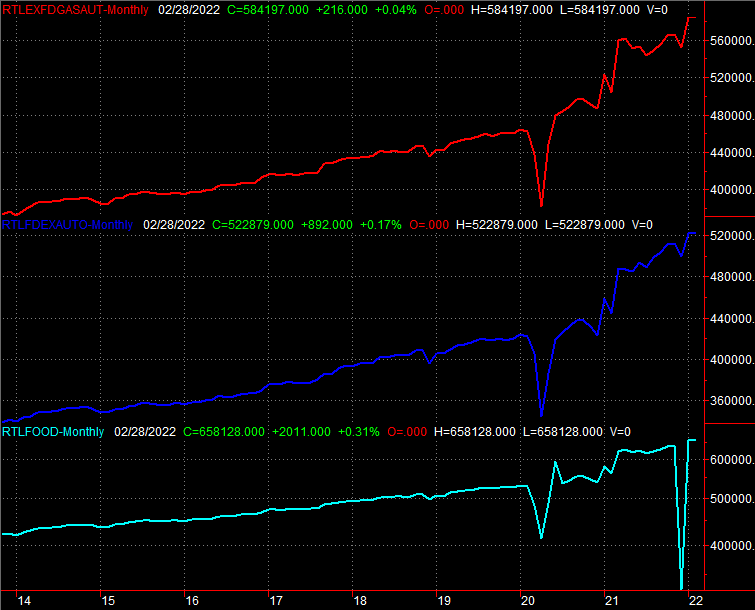
Source: U.S. Census Bureau, TradeStation
In a similar sense, the country's factories and production facilities remain increasingly busy. Our utilization of factory capacity grew from 77.3% to 77.6%, while actual factory output grew another 0.5% from January's production. More than that though, the trajectories here remain outstanding.
Capacity Utilization and Industrial Productivity Charts
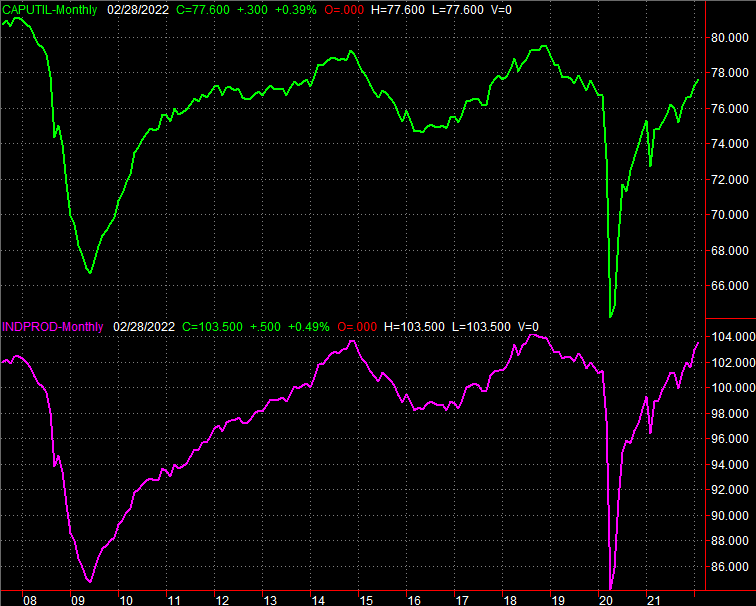
Source: U.S. Census Bureau, TradeStation
Finally, real estate remains something of a mixed bag.
Interest in building remains solid enough. Building permits slipped slightly in February, falling from 1.89 million to 1.86 million, while housing starts grew from 1.66 million to 1.77 million. In both cases though, the bigger trend is still pointed upward.
Housing Starts and Building Permits Charts
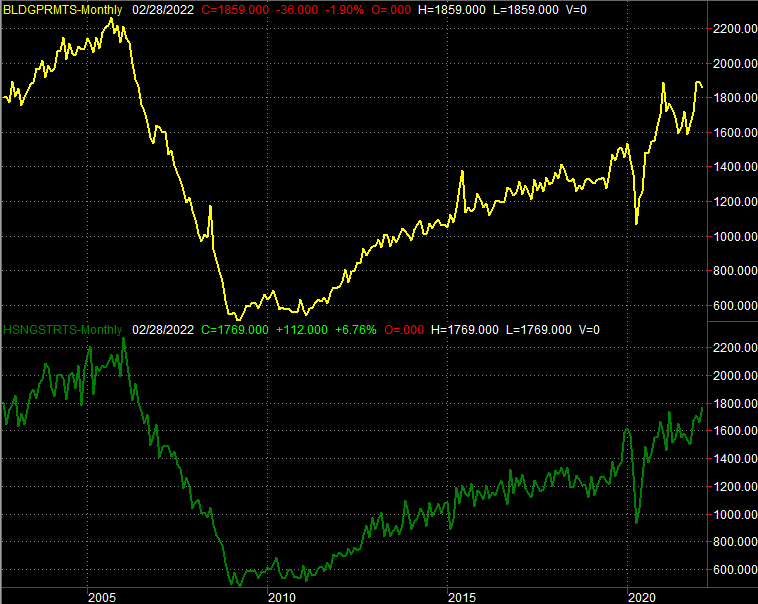
Source: U.S. Census Bureau, TradeStation
Sales of existing homes, however, fell from 6.5 million to just a little over 6.0 million.
New and Existing Home Sales Charts
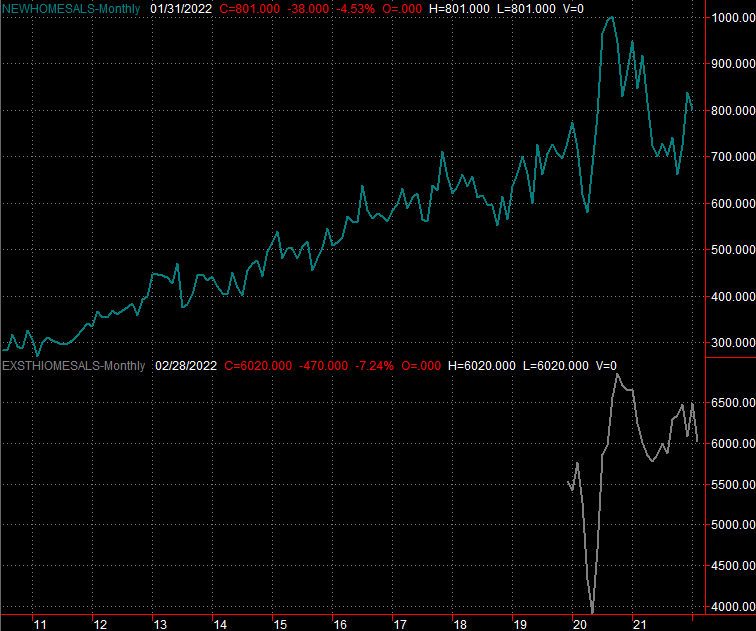
Source: U.S. Census Bureau, National Association of Realtors, TradeStation
We don't have last month's new home sales numbers; they're due this week. Economists are calling for January's pace of 801,000 to accelerate to 820,000. From what we can broadly see so far though, it's starting to look like sky-high housing prices may finally be starting to cause buyers to balk.
Everything else is on the grid.
Economic Calendar
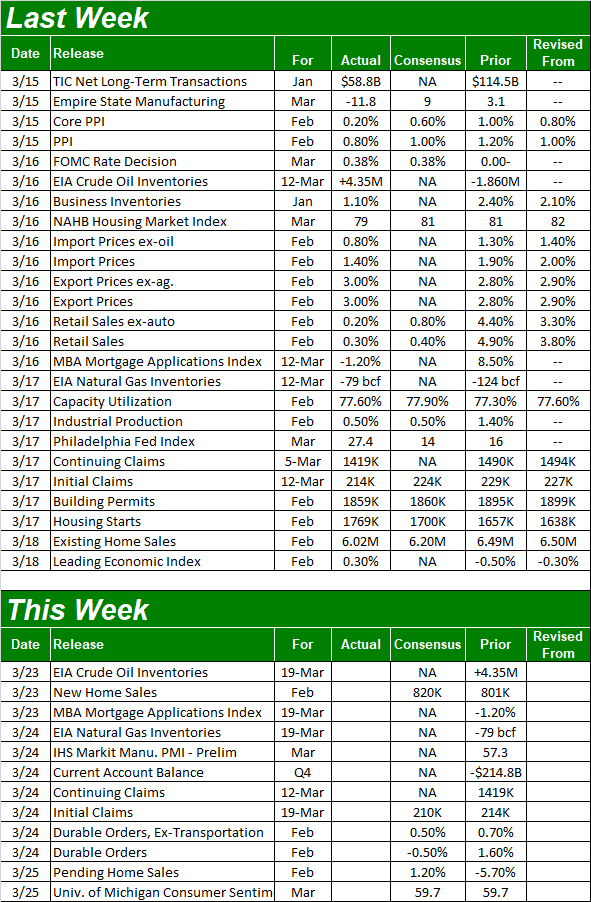
Source: Briefing.com
Aside from last month's new home sales numbers, there's not a lot of interest coming this week. The only item of interest, in fact, is Friday's third and final look at March's University of Michigan Consumer Sentiment Index. As expected, it's low. We'll plot a chart of it with the simile Conference Board consumer confidence figure a week from now.
Stock Market Index Analysis
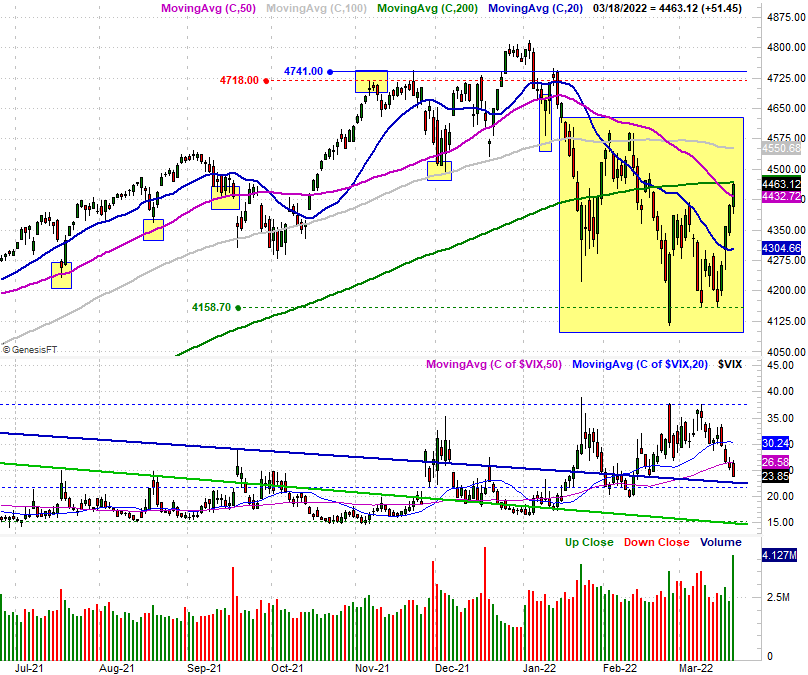
This week's analysis begins with a look at the weekly chart of the S&P 500, as this bigger-picture perspective is required reading before diving into the intricacies of the daily chart. Namely, note the sheer size of last week's rally. Also note that even with the 6.1% bounce, the index didn't climb back above its 200-day moving average line (green), nor was last week's volume any better than the volume seen for the prior two weeks. Given the size of the gain, one would have expected more buyers to be piling into it.
S&P 500 Weekly Chart, with VIX and Volume
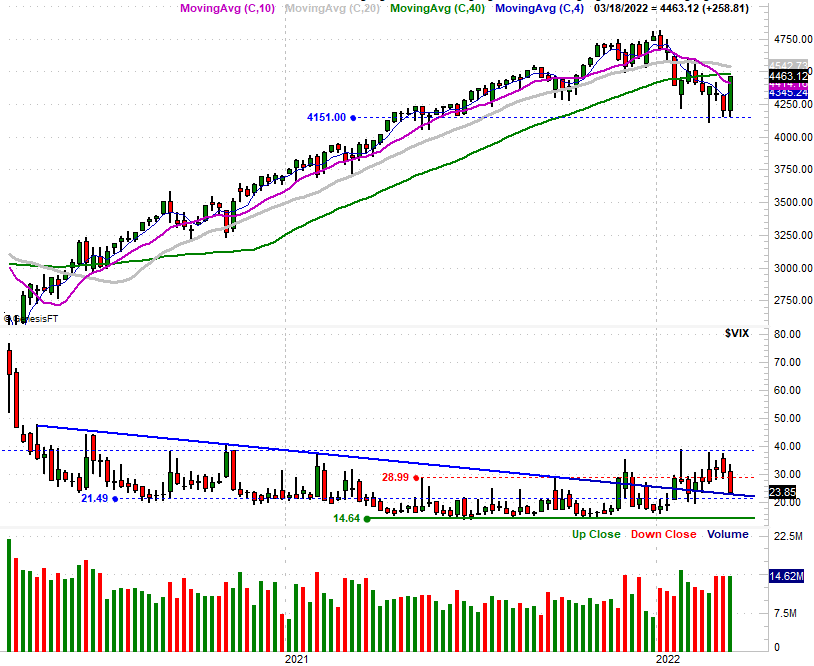
Source: TradeNavigator
Zooming out to the daily chart of the S&P 500 gives us an even better handle on the situation. The index did move back above the 50-day line (purple) at 4432, but only had to threaten the 200-day moving average line at 4472 to come to a halt. And, as for Friday's volume surge, given the lack of volume between Tuesday and Thursday, Friday's soaring volume is mostly attributable to that day's option expiration. A bunch of traders didn't suddenly get off the sidelines.
S&P 500 Daily Chart, with VIX and Volume
Source: TradeNavigator
Still, there are some undeniably bullish attributes with both the daily and the weekly chart of the S&P 500. Chief among them is the bullish momentum now seemingly in place, and the fact that the VIX is falling. The VIX's decline suggests traders really are confident in the rebound, and are (mostly) choosing not to hedge against a pullback.
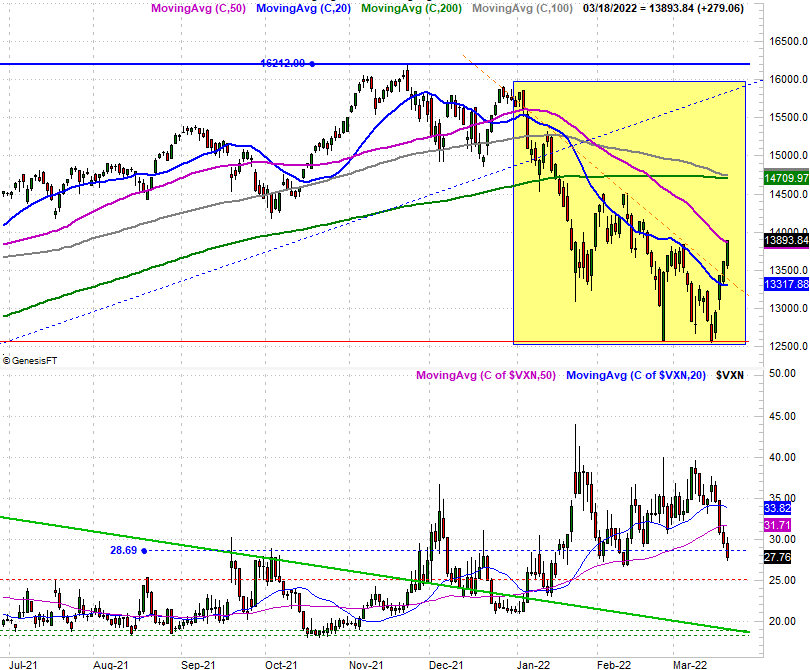
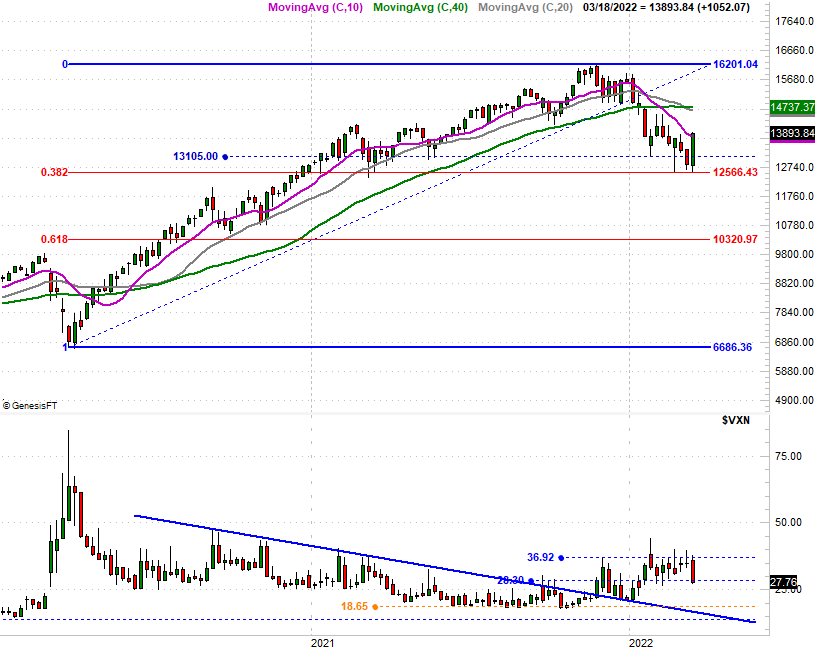
The chart of the NASDAQ Composite tells the same basic story. That is, last week was an enormous win, but doesn't yet snap stocks out of a downtrend. The composite's 8.2% advance did get it back above its 50-day moving average line (purple), and the VXN did mirror the move with a sizeable pullback. Most notably, however, the reversal took shape when the 38.2% Fibonacci retracement line at 12,566 was kissed for a second time early last week. Clearly it means something, and may come back into play in the future.
NASDAQ Composite Weekly Chart, with VXN
Source: TradeNavigator
Here's the daily chart of the NASDAQ. It's been quite a ride since the end of last year. Last week's move did push the index above a falling resistance line (orange, dashed) that had been guiding it lower since early this year, which is bullish. Still, the move was almost too strong for its own good, not leaving much room for any real follow-through... at least not right away.
NASDAQ Composite Daily Chart, with VXN
Source: TradeNavigator
Odds are good we'll see some profit-taking pressure this week. Don't read too much into it at first. But, know that such pressure will be a test of the bulls' conviction. If they come back swing and fight their way above the aforementioned moving average lines, that's clearly bullish. If instead they suffer a small setback that evolves into a bigger setback that starts to pull stocks under floors hurdled last week, that's bad. The good news is, those lines in the sand are very well marked.