Weekly Market Outlook – Small Cracks Showing, But Don’t Panic Yet

Stocks suffered another loss last week… albeit a small one. And, depending the index, no serious damage was done. Moreover, in the one case where a key floor did finally start to break, several more are still below, waiting to stop the bleeding. And it all may mean nothing anyway. Friday was an option expiration day, forcing a lot of artificial trading activity. Much of it leaned bearishly, but that pressure may not exist as the new trading week kicks off.
Still, regardless of the reason a hole was poked in the boat, there’s now a hole in the boat. Water could start leaking in.
We’ll look at the situation below in a moment. Let’s first work through last week’s biggest economic announcements and preview what’s coming this week.
Economic Data Analysis
This week’s highlight is of course February’s inflation data. It’s still with us. It’s not horrific. In fact, core consumer inflation continued to edge just a little bit lower. Overall consumer inflation is mostly leveling off well above the Fed’s target levels though, and last month’s producer inflation made a clear push higher for a second month in a row. That may well put upward pressure on consumer prices in the foreseeable future. Of more interest to traders and investors, this lingering inflation suggests that the Federal Reserve may not be able to cut interest rates as soon or as aggressively as recently hoped/expected.
Inflation Rate Charts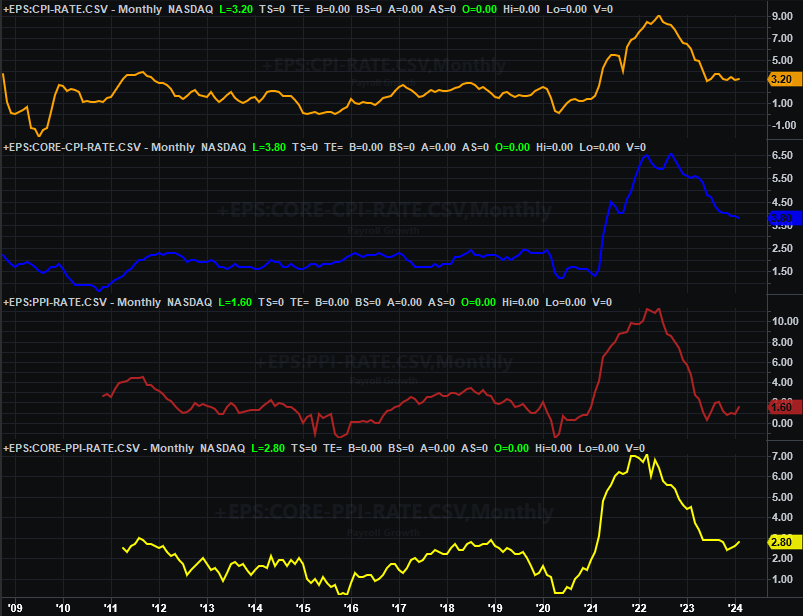
Source: Bureau of Labor Statistics, TradeStation
We also heard last month’s retail sales figures last week. They’re a bit concerning as well. Retail consumption has been mostly flat for a few months now, and tepid for over a year. That may be a function of higher price. More plausibly though, higher prices on some fronts is crimping retail spending on even more discretionary goods. Whatever the cause, this too is a concern.
Retail Sales Charts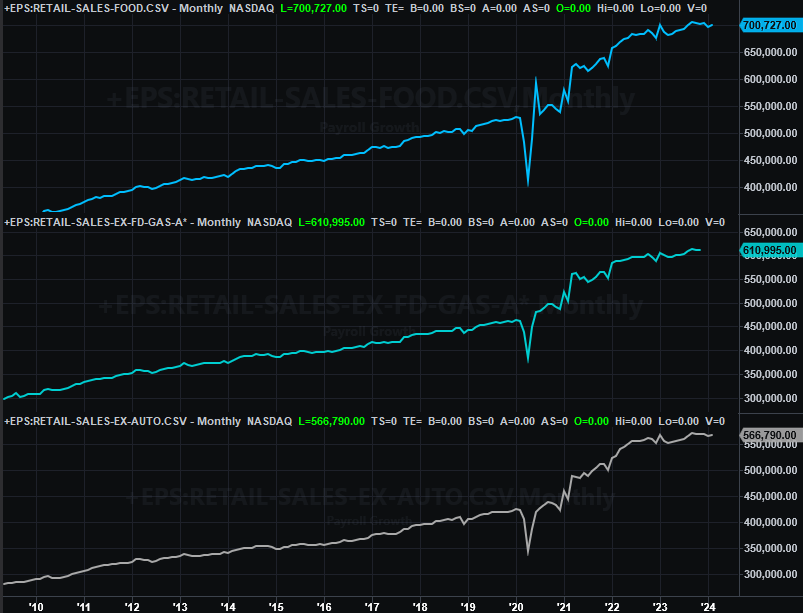
Source: Census Bureau, TradeStation
On Friday we got February’s industrial productivity and capacity utilization data from the Federal Reserve. These aren’t numbers the Fed directly considers when making interest rate decisions, but they can be a contributing factor. And either way, these are data points that the indicate broad health of the economy. And… they’re not great either. Both utilization rates and industrial output continue to fade, suggesting the economy is slowing down.
Industrial Production and Capacity Utilization Charts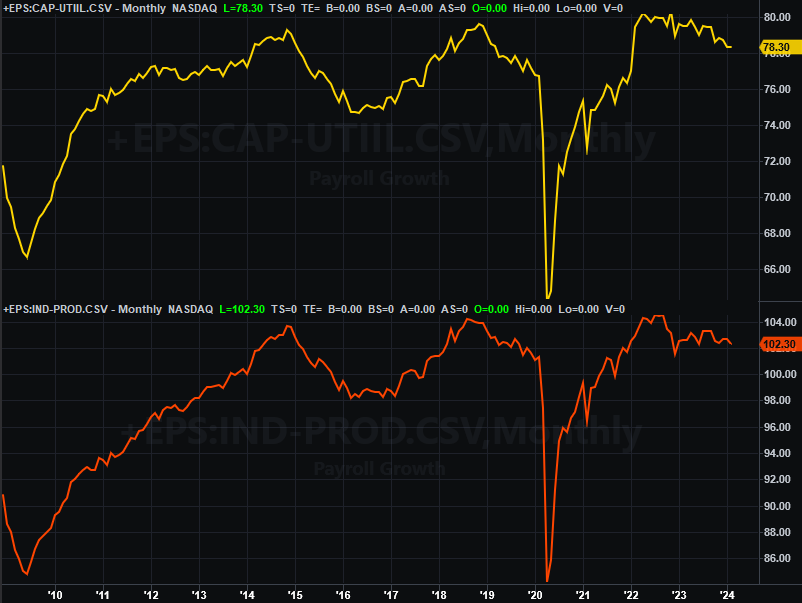
Source: Federal Reserve, TradeStation
It all matters simply because Federal Reserve will be making a decision regarding interest rates this week. As it stands right now, 99% of traders don’t expect rates to be cut at all.
Everything else is on the grid.
Economic Calendar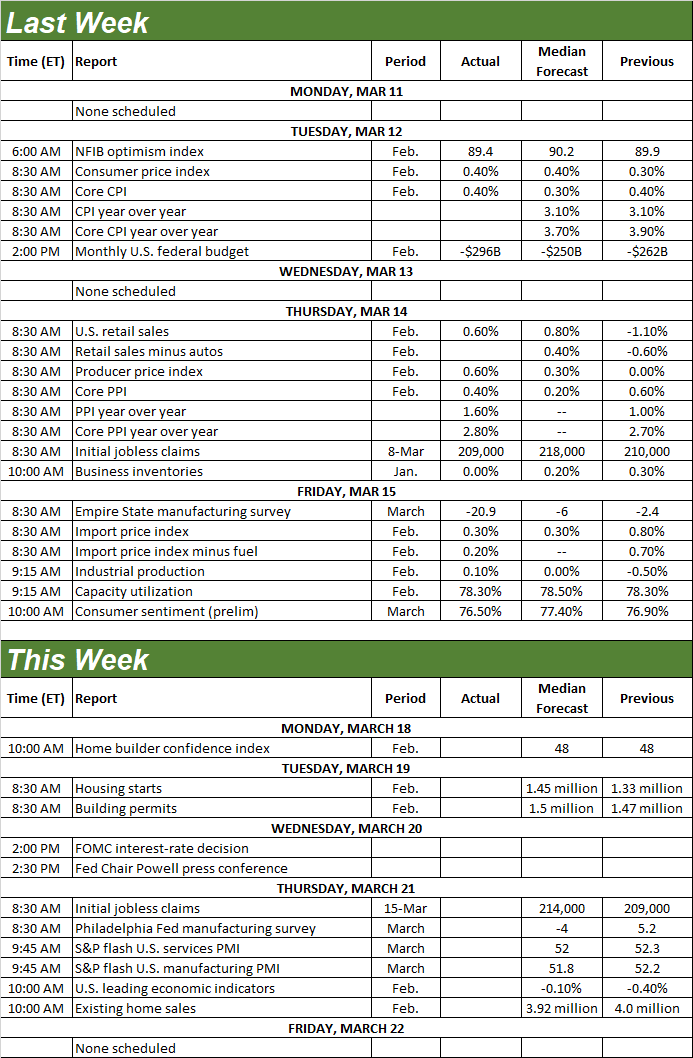
Source: Briefing.com
In addition to the interest rate decision on Wednesday, we’ll get a couple of other important reports this week… particularly on the real estate front.
One of them is Tuesday’s look at February’s housing starts and building permits. Economists are calling for better numbers than we saw in February. However, that’s a bounce from rather low levels. One better month isn’t going to make a dent in the overall weakness here.
Housing Starts and Building Permits Charts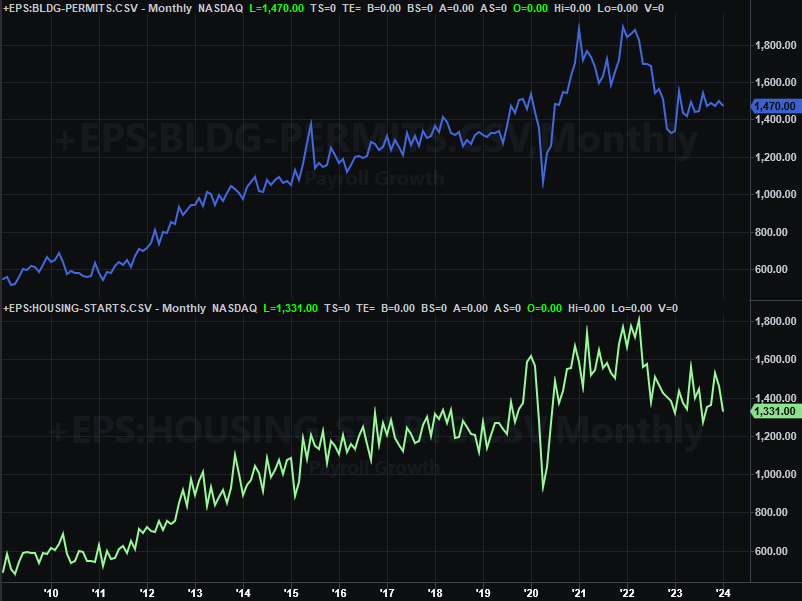
Source: Census Bureau, TradeStation
Then on Thursday we’ll get last month’s numbers for existing home sales. Forecasts say they’ll fall slightly from January’s measurable-but-modest uptick from a multi-year low.
New, Existing Home Sales Charts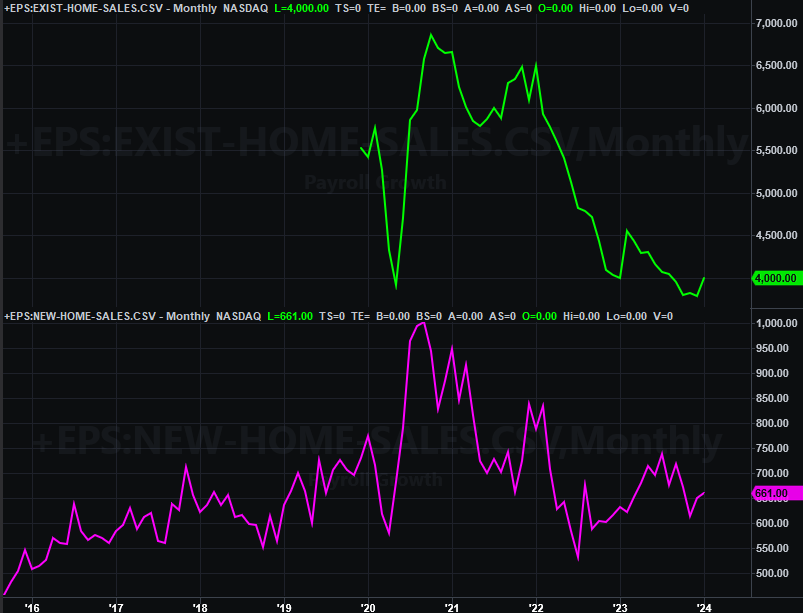
Source: Census Bureau, National Assn. of Realtors TradeStation
New home sales figures are coming next week. They’re pretty weak on an overall basis as well. Bear in mind that starts and permits tend to trend hand-in-hand with new home sales. Those numbers we’re getting on Tuesday of this week may point to the sort of figure we’ll be getting next week. Monday’s look at homebuilder confidence will also indicate what’s really happening in terms of the new home-construction market.
Stock Market Index Analysis
The bigger picture rally is still alive. It took a bit of a blow last week, but not enough for the bulls the panic just yet.
The blow was entirely and exclusively suffered by the NASDAQ Composite. Namely, it fell below its 20-day moving average line (blue) on Friday, and closed below that level.
NASDAQ Composite Daily Chart, with VXN and Volume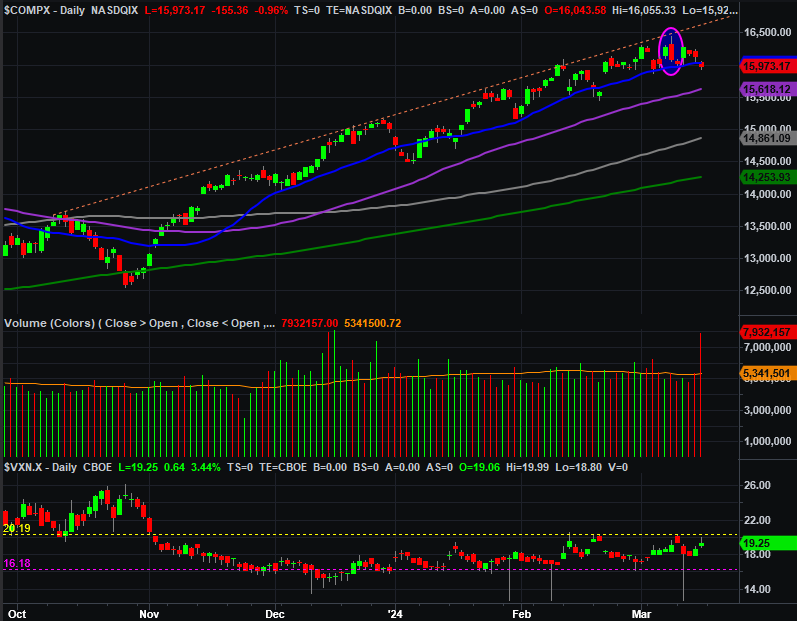
Source: TradeNavigator
It’s not yet the end of the world. The composite’s dipped under its 20-day line a few times since October’s reversal, and it didn’t jump-start a full-blown correction. This one might not either. Plus, Friday was an expiration day… a day that can skew the market’s direction.
This is the first time we’ve seen this sort of action, however, following such a big runup. It’s also the first time we’ve seen this technical stumble following such a sweeping intraday reversal on the previous Friday (circled on the chart above). All it took was a kiss of the technical ceiling that connects all the key highs going back to October’s peak (orange, dashed) to prod what looks like the beginning of a more serious effort to start a wave of profit-taking. These are some of the earmarks of the beginning of a corrective move.
Except, the S&P 500 isn’t playing along. This index appears to be finding support at its 20-day moving average line (blue) at 5,100. This of course bolsters the bullish argument.
S&P 500 Daily Chart, with VIX and Volume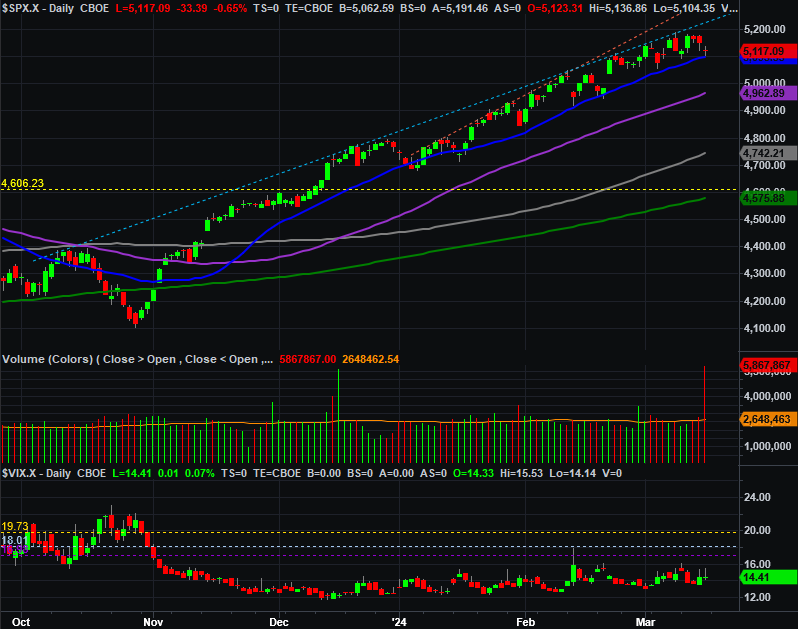
Source: TradeNavigator
Here’s the weekly chart of the NASDAQ Composite, for some more perspective. It’s from this vantage point we can see just how far the index has climbed since October’s low. It’s a lot. There’s a great deal of pent-up profit-taking potential to unleash.
NASDAQ Composite Weekly Chart, with VXN and Volume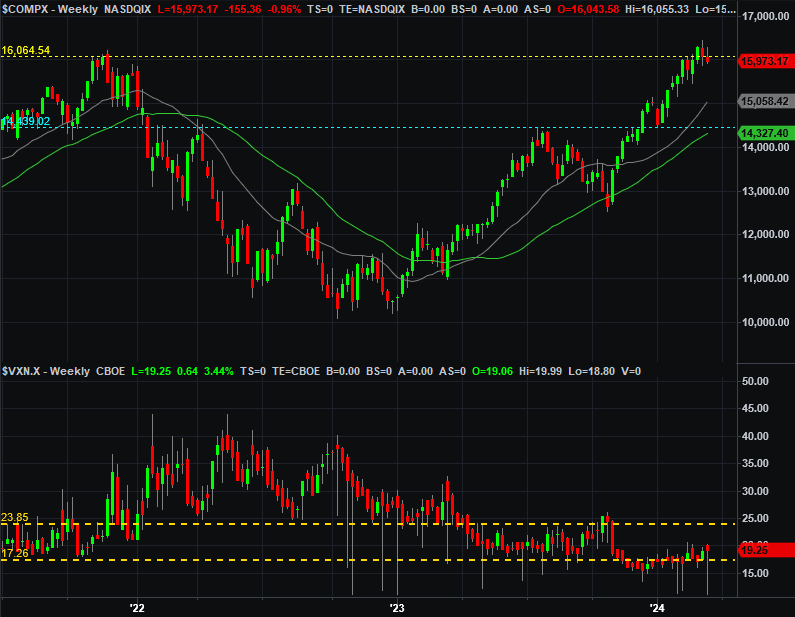
Source: TradeNavigator
Even if the profit-takers pull the trigger though, that doesn’t necessarily end the bull market.
The S&P 500’s weekly chart looks about the same. That is, after a big rally, the last couple of weeks’ bars are showing some telltale signs that the rally is now out of steam. That’s primarily a couple of back-to-back weekly doji bars, where the open and close are basically at the same level, and right in the middle of the low-to-high range. It’s a hint that the bulls are starting to have second thoughts.
S&P 500 Weekly Chart, with VIX and Volume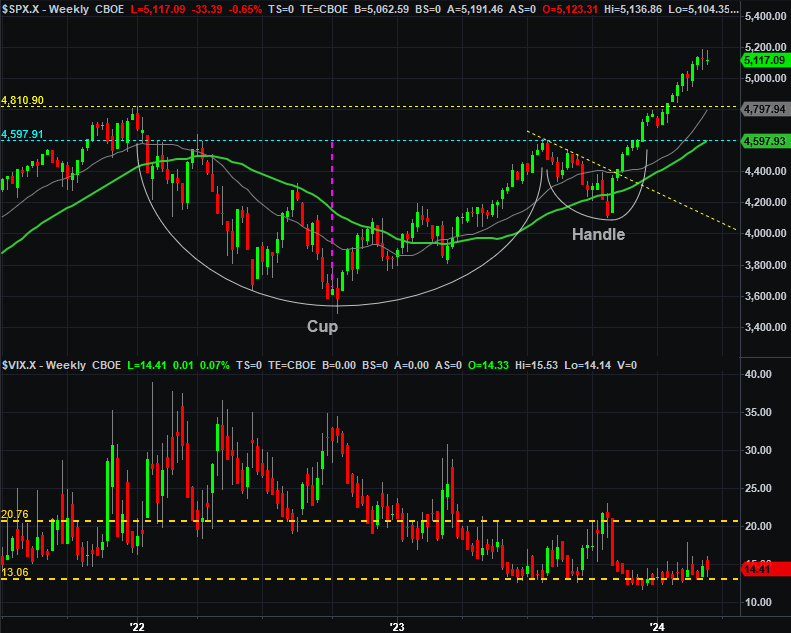
Source: TradeNavigator
For now, the best thing to do is nothing. Last week’s option expiration likely impacted the market, but it’s not easy to know how it would have done so. And, it may not matter anyway. Where stocks ended last week is where they’ll start this week, and they did suffer a little bit of damage last week that could have a lingering effect.
Let’s let the chips fall this week before making any major decisions. If this is the beginning of a correction, we’ll know for sure soon enough.