Weekly Market Outlook – Riding the Bullish Guardrails

Despite the rocky start to the week, the bulls finally got on… well, got on their horses to push the market to yet-another new high. Perhaps more important, the NASDAQ Composite finally punched through a major technical ceiling that frees it up to keep moving higher.
And yet, both of the indices are once again testing other resistance lines.
That’s not necessarily a bad thing though. In fact, it’s arguably a good thing. This resistance keeps things moving higher at a limited, sustainable pace. The rising support lines are firming up as well, by virtue of being tested and proven several times now. There’s room and reason to expect a dip, but not a big one.
We’ll look at this in some detail in a moment. First, let’s look at last week’s most important economic reports and preview what’s in the lineup for this week.
Economic Data Analysis
Broadly speaking, the bulk of last week’s economic news was less than bullish.
Home sales were something an exception to this theme. Sales of new houses ticked a little higher to 661,000, marking the second week of forward progress. You may also remember January’s sales of existing homes reported a week earlier also moved higher, with both coming up and off of multi-month lows. Though up, it’s too soon to call this the beginning of a real estate rebound.
New, Existing Home Sales Charts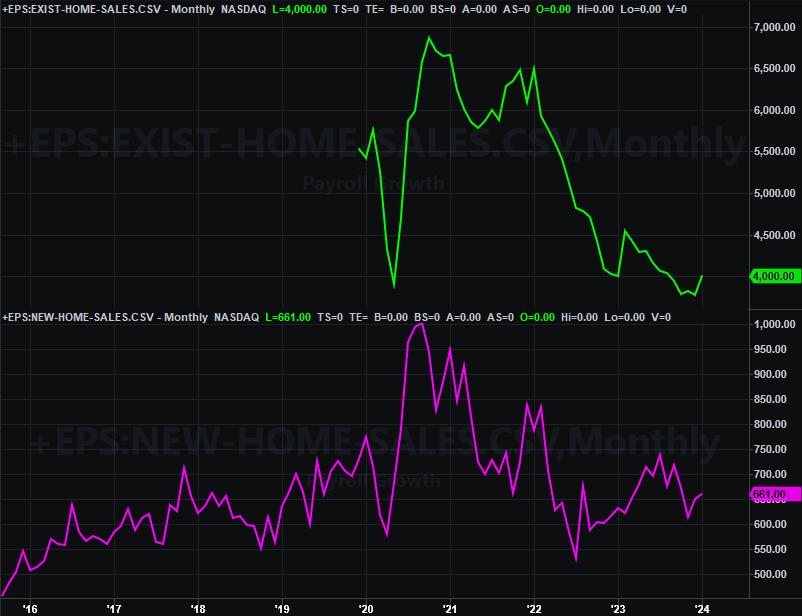
Source: National Association of Realtors, Census Bureau, TradeStation
Underscoring this real estate red flag is weakening home prices. The FHFA Home Price Index moved a little higher through December, but the pace of growth is slowing. In the meantime, the Case-Shiller Index fell for a second month in a row. It’s hardly disastrous, but this does indicate a (much-needed) real estate correction could be brewing.
Home Price Charts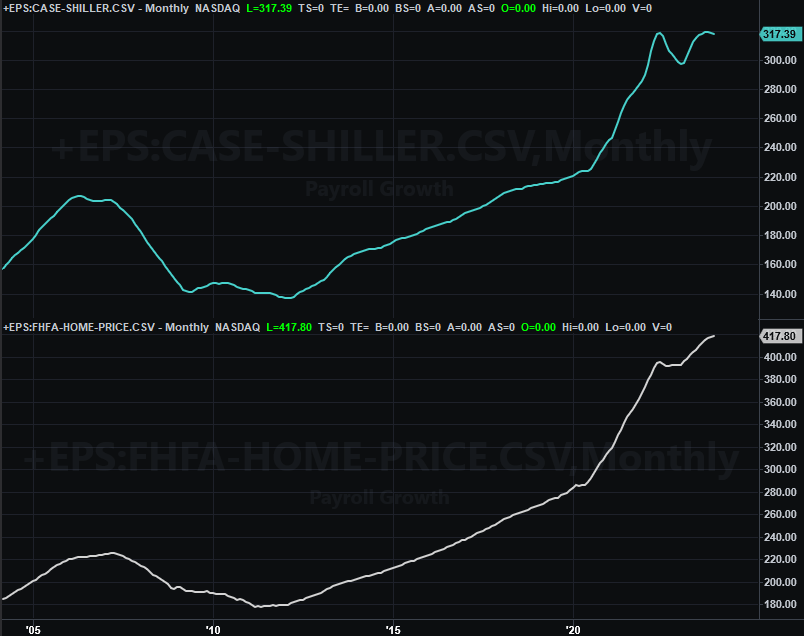
Source: Standard & Poor’s, FHFA, TradeStation
Sentiment’s unraveling too. The Conference Board’s measure of consumer confidence fell from 110.9 to 106.7 in February, while the University of Michigan’s sentiment score slipped to 76.9. The latter was well up in January, leaving it subject to at least a slight pullback. The Conference Board’s score wasn’t as vulnerable, but it’s also not been recovering from 2022’s lull.
Consumer Sentiment Charts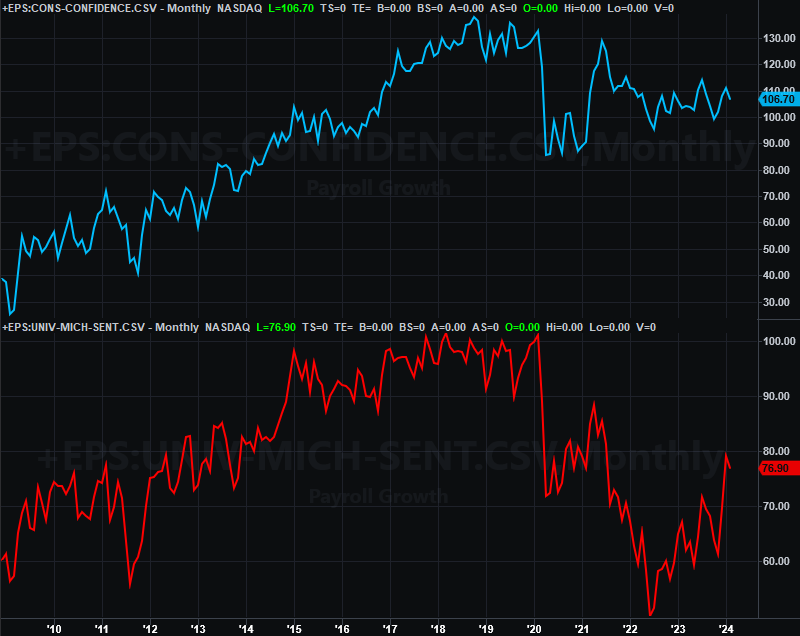
Source: University of Michigan, Conference Board, TradeStation
Don’t overreact to one so-so month. But, a couple more months of deteriorating consumer sentiment is a worry. Of course, stocks could suffer a correction and be on the road to recovery -- if it’s just a correction and not a bear market -- by the time we see a couple more bad months.
And there are a couple of reports worth noting that we don’t have charts for.
The first of these is last month’s personal spending and personal income data, which the Federal Reserve predominantly uses to make interest rate decisions. Good news! Both are cooling off… although that may not be good news when all is said and done. That gives the Fed a little room (maybe a lot of room) to not impose rate cuts as quickly anticipated this year.
The other data nugget is the first look at Q4’s GDP growth rate. The first (of three) estimates suggests growth of 3.2%. That’s not quite the 3.3% economists were looking for, but it’s still healthy. It’s also the sixth-straight quarter of forward progress.
Everything else is on the grid.
Economic Calendar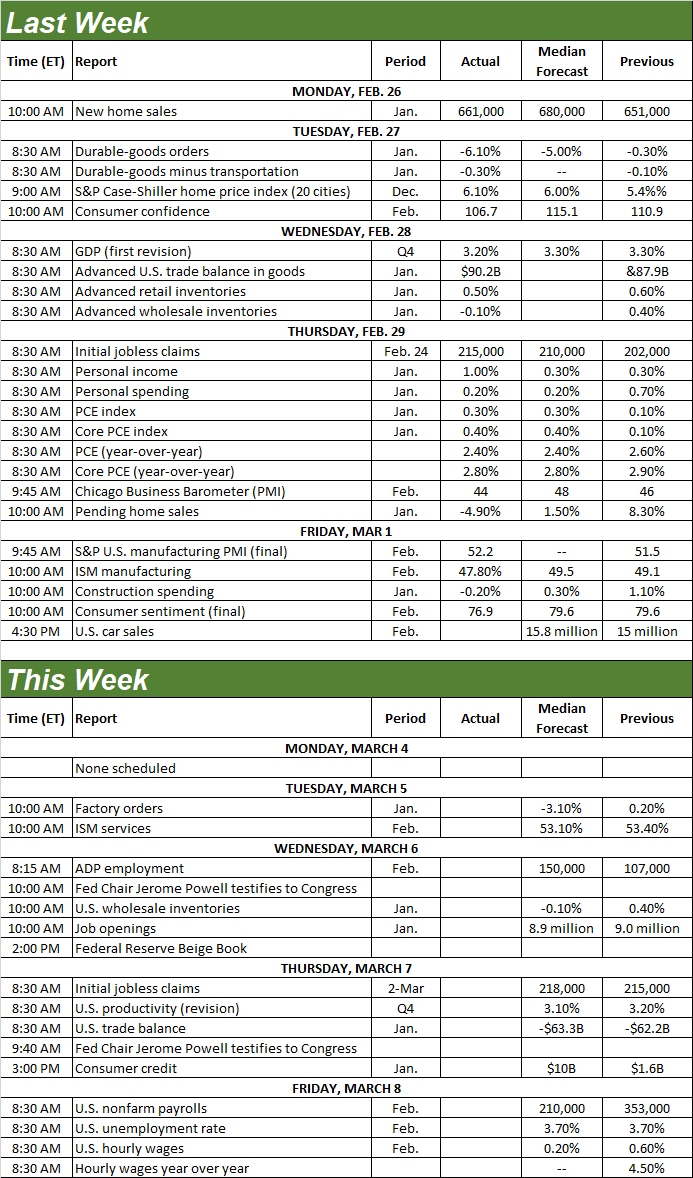
Source: Briefing.com
This week isn’t going to be quite as busy, but there are a couple of biggies.
The first of these is the February update of the Institute of Supply Management’s measure of services activity, due on Tuesday. Forecasters say it’s going to fall slightly, but should still remain above the critical 50 mark. The Manufacturing Index also remains below 50, but fell even further below that level with its February update posted last week. Regardless of either index’s direction last month, both are at relatively low levels.
ISM Services, Manufacturing Index Charts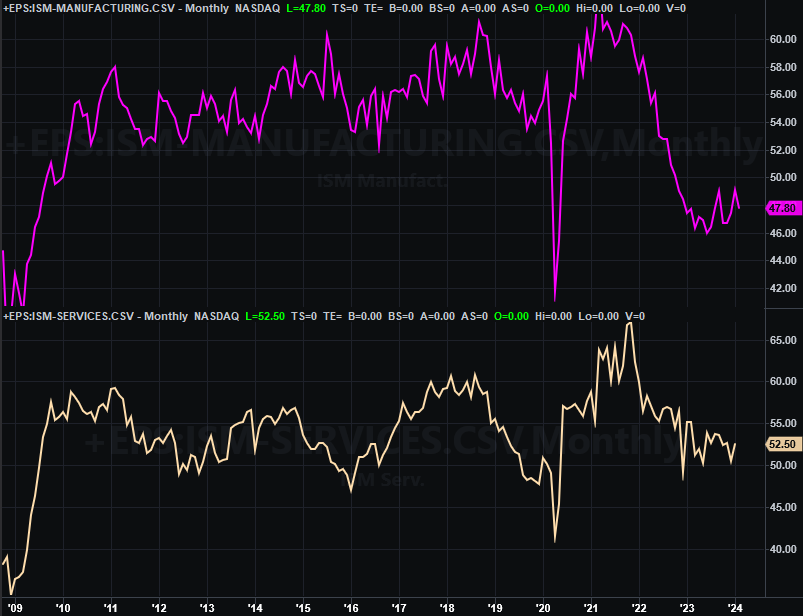
Source: Institute of Supply Management, TradeStation
Then on Friday we’ll hear February’s unemployment rate and payroll growth numbers. Job growth should slow dramatically to 210,000, but that’s a slowdown from a very high January reading of 353,000. That won’t be enough to lower the unemployment rate from its current level of 3.7%. Again though, that’s a pretty healthy reading already.
Unemployment Rate and Payroll Growth Charts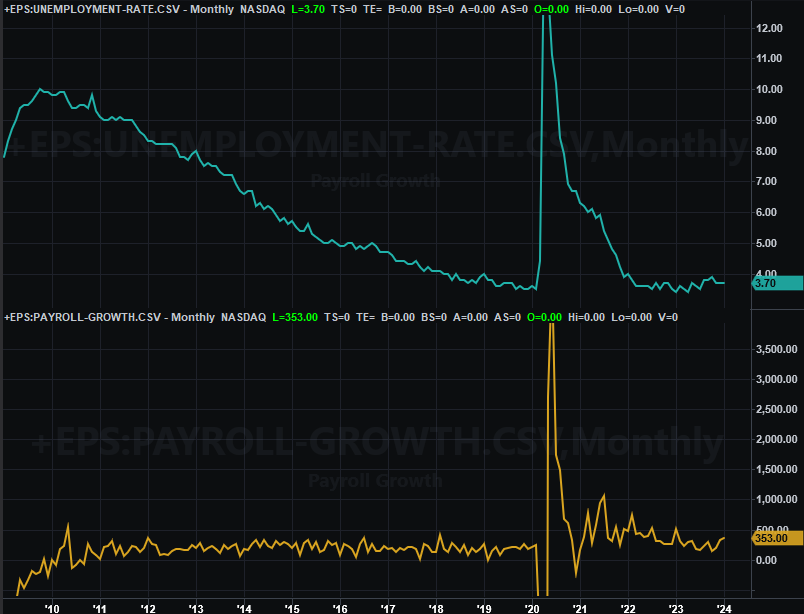
Source: Bureau of Labor Statistics, TradeStation
Stock Market Index Analysis
We start things this week with a look at the weekly chart of the NASDAQ Composite. Why? Because it tells us -- and shows us -- the most about the current state of the market. And that is, stocks are in breakout mode. With the composite’s move above resistance around the 16,065 mark (finally!), the index is now at record highs. There’s also nothing else technical standing in the way of its continued advance.
NASDAQ Composite Weekly Chart, with VXN and Volume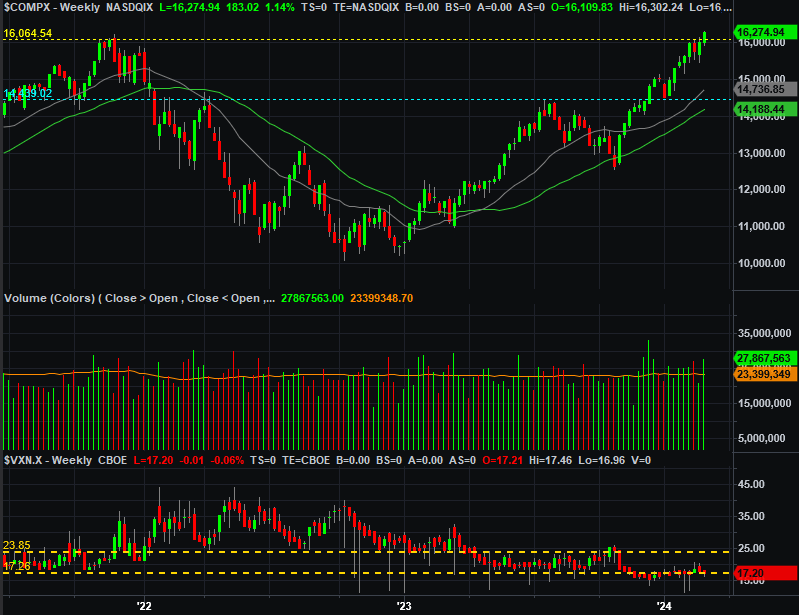
Source: TradeNavigator
As amazing as this sequence of events may feel, it can’t be that surprising. Much like the S&P 500, the NASDAQ completed a cup-and-handle pattern back in December. With the brim line at 14,460 being breached (or 4,600 for the S&P 500), the NASDAQ could rally the entire height or span of its “cup.” That would push it all the way up to the 18,600 level. The S&P 500’s post-cup-and-handle advance could run all the way up to 5,800 before reaching a ceiling.
S&P 500 Weekly Chart, with VIX and Volume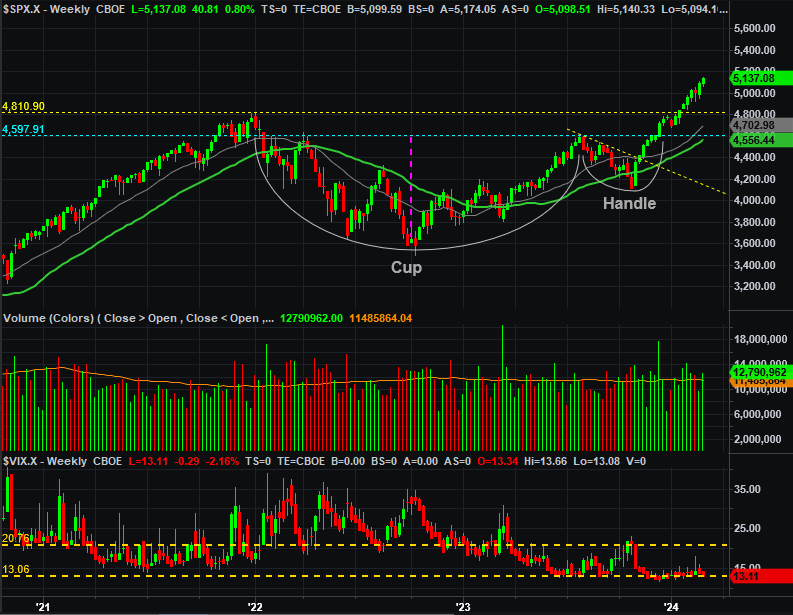
Source: TradeNavigator
Those are just possibilities based on tendencies, to be clear. There are clear barriers to such bullish outcomes this time around. Chief among them is valuation. As of the latest look the S&P 500 is trading at nearly 23 times its trailing earnings, and almost 21 times its forward-looking earnings, That’s a lot.
That being said, these cup-and-handle patterns are long-term frameworks. It’s possible both the NASDAQ Composite and the S&P 500 could grow their earnings as both make forward progress, never becoming more overvalued than they are right now. There are shorter-term matters to keep in mind in the meantime… matters like the fact that the NASDAQ Composite is using a rising technical resistance line (orange, dashed) as a guardrail.
NASDAQ Composite Daily Chart, with VXN and Volume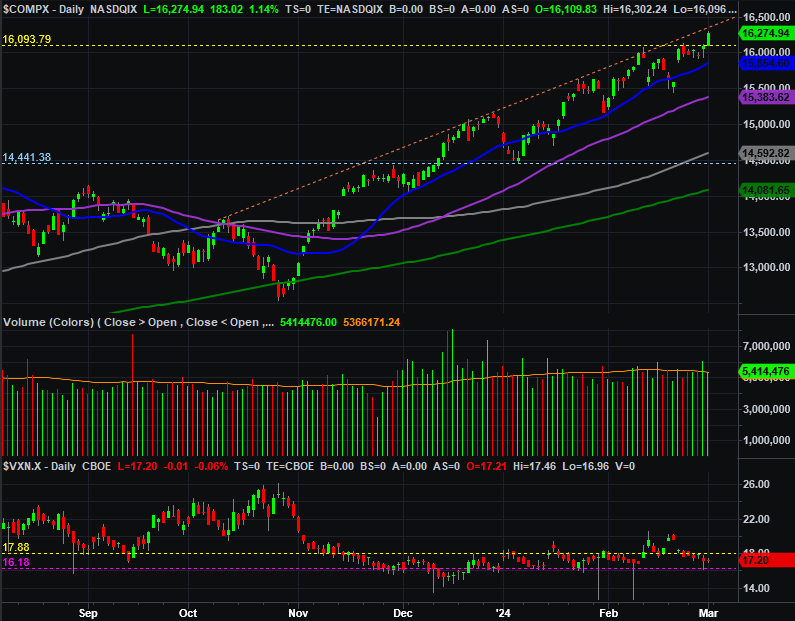
Source: TradeNavigator
The S&P 500 is using a similar guardrail, testing but never crossing a resistance line that connects all the key highs going back to October’s peak (blue, dashed). Also note that the S&P 500 seems to be using the 20-day moving average line (solid, blue) as support.
S&P 500 Daily Chart, with VIX and Volume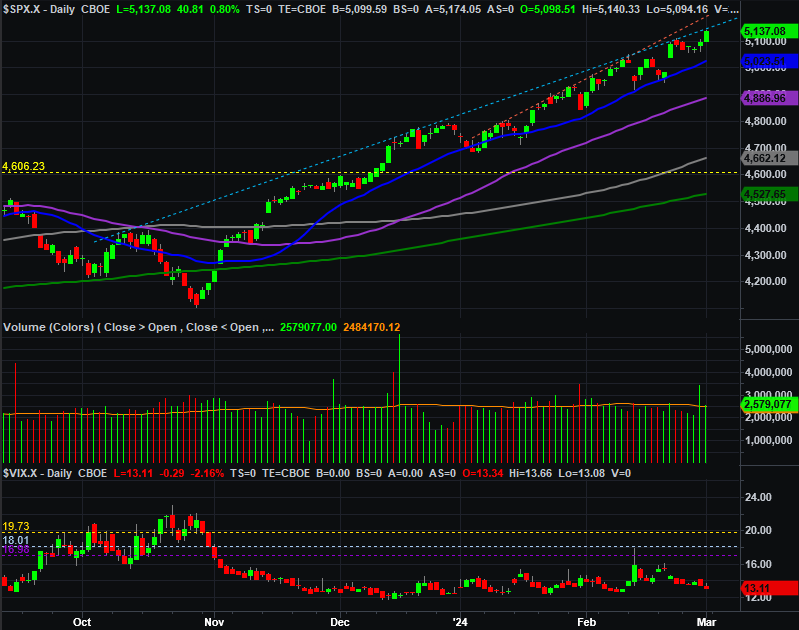
Source: TradeNavigator
So what’s the call? Short-term or long-term, the current trend is (still) bullish.
Oh, there’s risk to be sure. In addition to the market’s rich valuation the S&P 500’s 25% advance just since October’s low is a lot of ground to cover in such a short period of time. There’s some pent-up profit-taking lurking in the background.
Just don’t freak out if-and-when we see it unfurl. There’s also tons of technical support below that will keep any corrections relatively small. They’ll ultimately be buying opportunities.
On the flipside, while the trend is bullish -- and March is usually a bullish month anyway -- there may not be enough immediate upside on the table to add new (or more) bullish positions right now. The stage is set for at least a small near-term pullback, even if only back to the 20-day or 50-day moving average lines.