Weekly Market Outlook - On the Fence, Stuck In the Middle and Undecided
It's weeks like last week that can convince you the market is deliberately trying to drive you nuts. Just when it looked like stocks were ready to make good on a budding rebound effort, something up-ends the young rally. And yet, while last week was a loser, losses weren't big enough to say stocks are back in a clear downtrend. We are still very much on the fence, fully capable of easily moving in either direction.
We'll show exactly what we mean in a moment. First though, let's recap last week's major economic announcements, which arguably aren't getting enough of the credit for the recent wave of selling.
Economic Data Analysis
What a busy week! And -- for the most part -- not a good one.
Trouble started early on for the four-day trading stretch (Monday was MLK Day, with markets closed then) with last month's capacity utilization and industrial productivity report. The Federal Reserve says usage of the country's industrial capacity fell from 79.4% to a multi-month low of 78.%, in step with a clear continuation in waning production output. One weak month isn't a major concern, but this data has shown prolonged deterioration.
Industrial Production, Capacity Utilization Charts
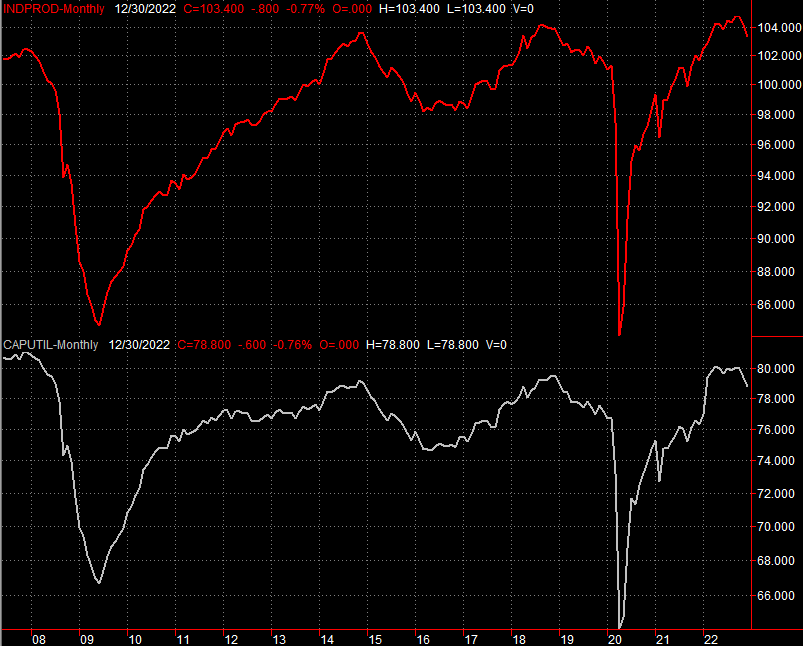
Source: Federal Reserve, TradeStation
Prices are still relatively high as well, although there's some relief on this front. The overall producer inflation rate pulled back from 7.4% to 6.2%, while producers' costs not counting food and fuel peeled back to a multi-year low of 4.6%. Both moved mirrored the waning inflation rate consumers are facing.
Inflation Rate Charts
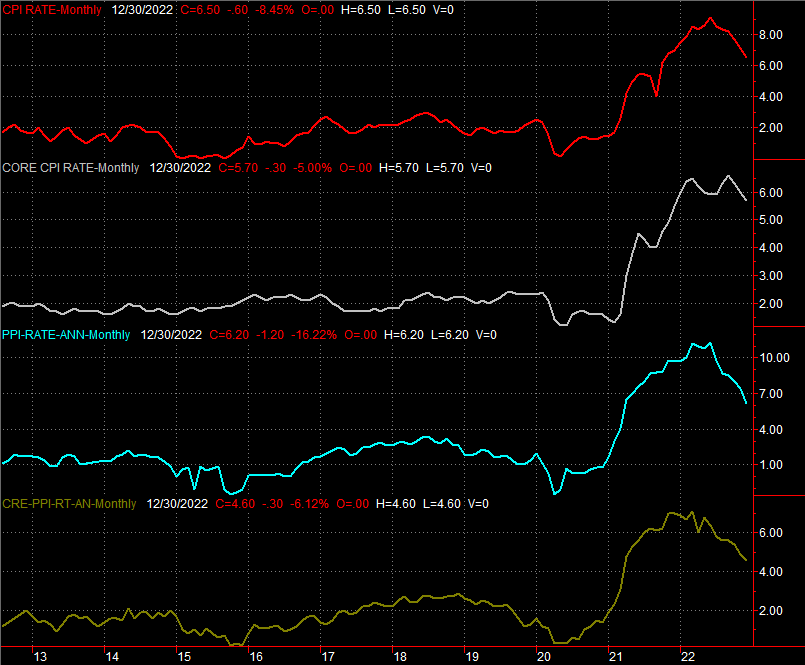
Source: Bureau of Labor Statistics, TradeStation
Except, prices are still relatively high, and still rising. That's why it can't be surprising that at the same time consumers are tightening their purse strings. Adjusted retail sales fell 1.1% last month, and fell by about the same when taking gas and food out of the picture.
Retail Sales Charts
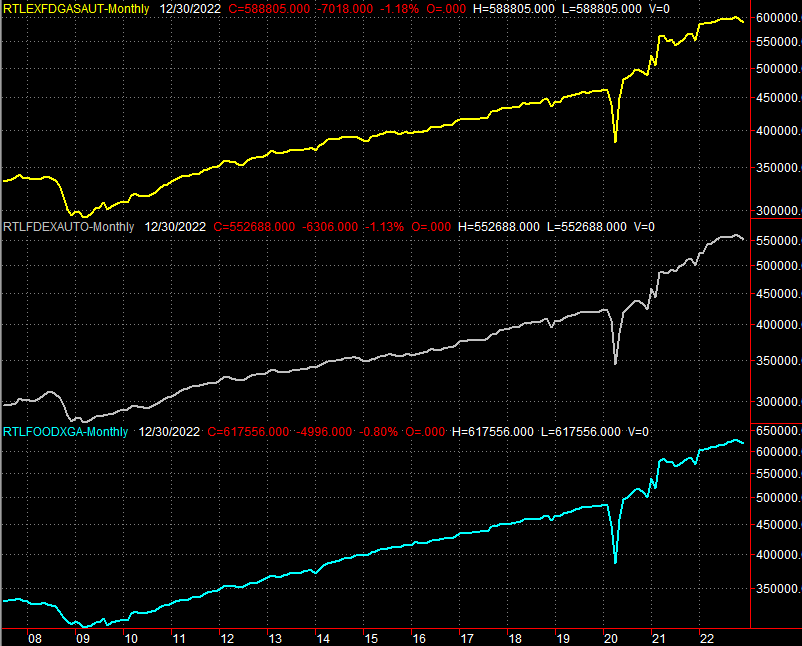
Source: Census Bureau, TradeStation
This too is the second month in a row we've seen retail consumption slip, and the decline can't simply be chalked up to lower prices. Remember, prices aren't falling. It's just that the rate of price increases is slowing.
Demand for new homes is fading as well. Housing starts fell from an annualized pace of 1.4 million to a 1.38 million last month, and the number of permits issued to begin construction of a new home plunged even further to a pace of 1.33 million. That's the lowest figure since early 2020, when the pandemic's arrival up-ended... well, everything.
Housing Starts and Building Permits Charts

Source: Census Bureau, TradeStation
Everything else is on the grid.
Economic Calendar

Source: Briefing.com
This week looks busy, but there's not much in the lineup that we're too concerned with.
We will be watching for Thursday's report of last month's new home sales to round out last week's look at December's existing home sales. It comes as no surprise the forecast is for yet-another drop... from 640,000 to 614,000, rekindling a downtrend that's been underway since late 2020.
We'll also keep a look out for Friday's third and final look at the University of Michigan Sentiment Index. It should be up -- again -- inching higher despite the lousy economic backdrop.
Consumer Sentiment Charts
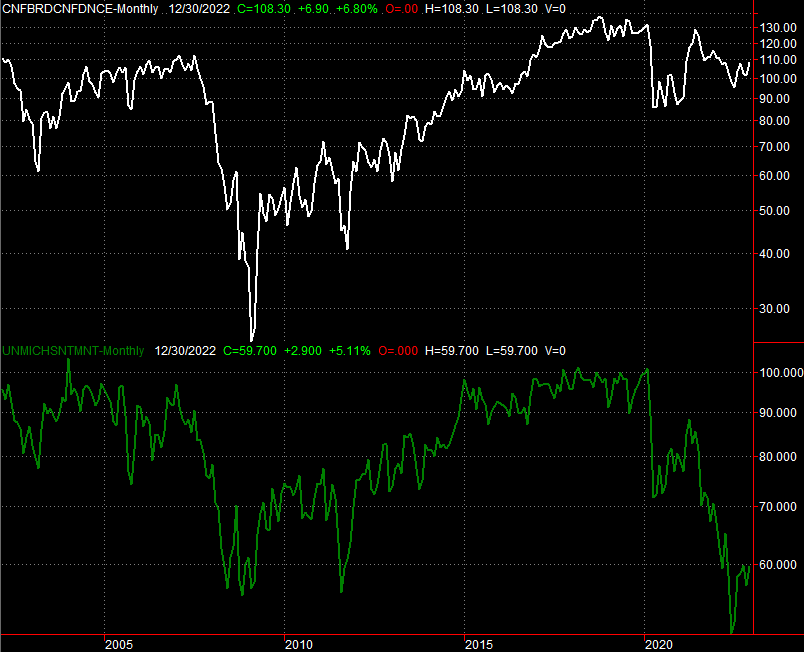
Source: University of Michigan, Conference Board, TradeStation
The consumer sentiment picture will be completed next week when the Conference Board releases its measure of January's consumer confidence.
Stock Market Index Analysis
Stocks finished last week on a high note. But, for the most part, it wasn't high enough.
Take a look at the daily chart of the S&P 500 to see. The index pushed up and off the 20-day moving average line (blue) at the low point of last week's tumble. But, the gain was only able to carry the S&P 500 up to its 200-day moving average line (green) and the straight-line support (red, dashed) that's kept the index capped for the better part of the past twelve months.
S&P 500 Daily Chart, with VIX and Volume
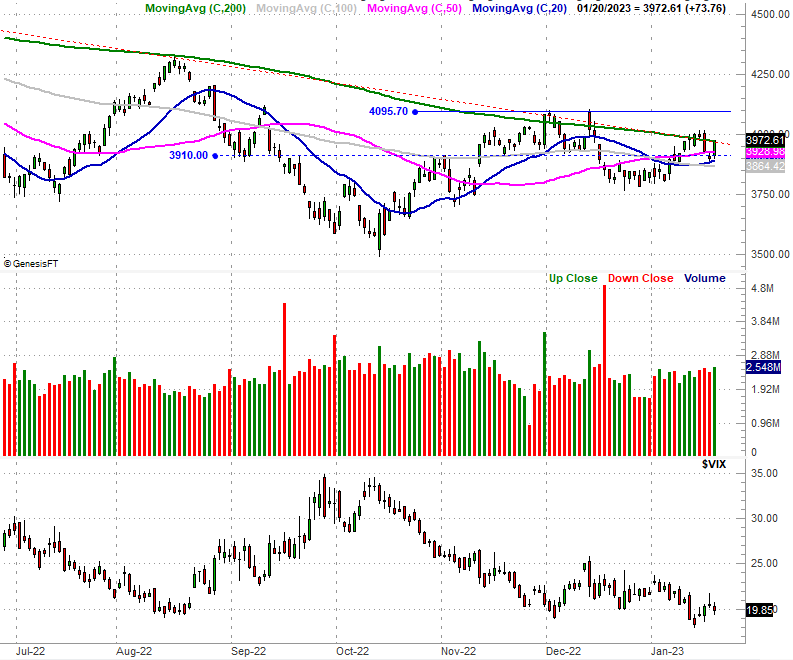
Source: TradeNavigator
Here's the weekly chart of the S&P 500 for a little added perspective on the selloff since last January's peak. From this vantage point, however, we can see a couple of other noteworthy things about the broad market. First, the S&P 500 finally made its first higher low in over a year; see the rising, blue dashed line. Second, the volatility index (or VIX) continues to push its way lower, and is now testing a major floor right around 19.0.
S&P 500 Weekly Chart, with VIX and Volume
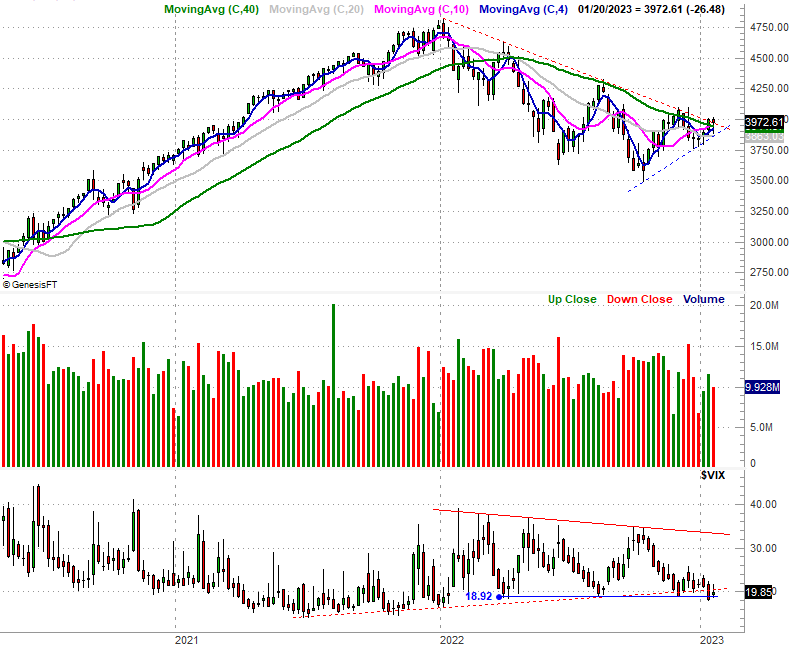
Source: TradeNavigator
This is encouraging... almost. The VIX needs to break below 19.0 and the index itself needs to break above 4000 (give or take) to get over the hump. But, we're closer to that happening than we've been in months.
And the NASDAQ Composite is doing similarly well. There's a major technical ceiling right around 11,550 that still needs to be cleared, but the composite did manage to move above its 50-day and 100-day moving average lines (purple and gray, respectively) with Friday's push. Those are technical bullish cues.
NASDAQ Composite Daily Chart, with VXN
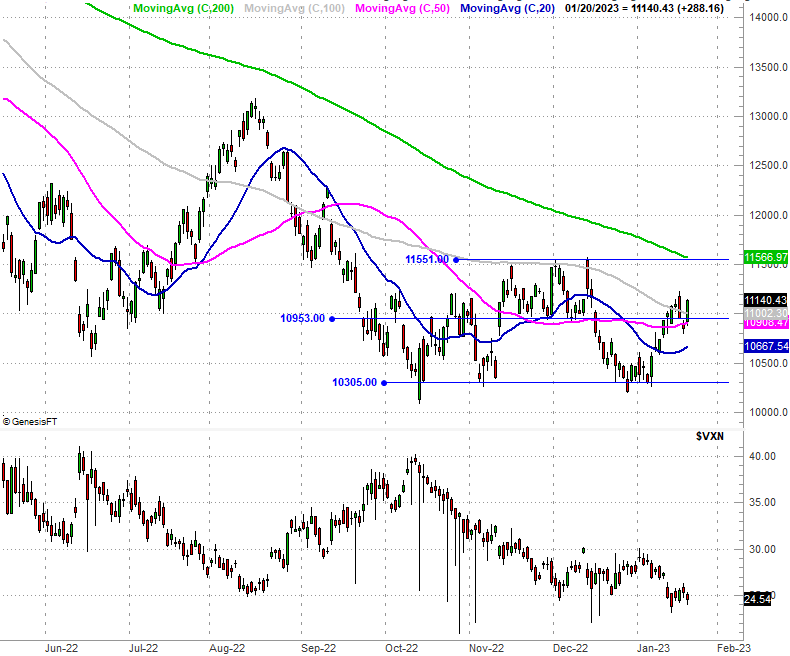
Source: TradeNavigator
Curiously, the Dow Jones Industrial Average made the least amount of technical progress last week. It tested its 20-day moving average line (blue) at 33,375, but wasn't actually able to clear it with Friday's gain.
Dow Jones Industrial Average Daily Chart, with Volume
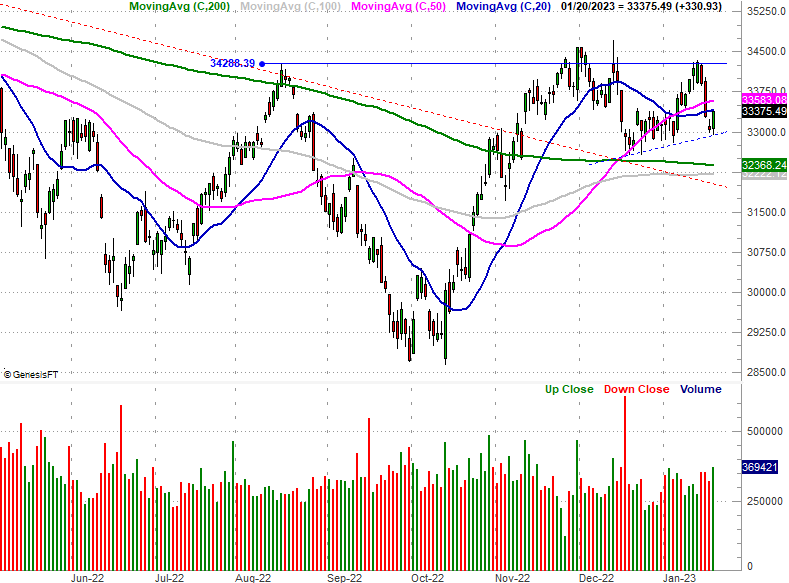
Source: TradeNavigator
There's not a lot of subtle interpretation that needs to be done here. Stocks are getting squeezed into the tip of a converging wedge, and we're almost to the point where there's no room left to move. The situation itself will soon force the bulls or the bears to take a stand and break past either a floor or a ceiling, but either one is still just as possible as the other.
On a side note, notice on the S&P 500's chart are nearing a convergence of their own. These lines tend to reliably cycle between convergence and divergence, so when we see a convergence taking shape we know a divergence is in the making. A divergence of course is the result a major, prolonged move from stocks. Again though, the question is which direction will the move drive the divergence?