Weekly Market Outlook – Nice Week, But Stocks Aren’t Out of The Woods Yet

Things were touch-and-go for most of the week, with the market poised log its fifth weekly loss in a row early Friday. Then something jolted the bulls into action. The S&P 500 rallied an impressive 1.18% on Friday, leading stocks a much-needed weekly win.
Don’t pop the corks on the champagne bottles just yet, however. We had every reason to expect the bulls to make a stand where they did. And, even with their effort, the market could still easily slip back into trouble and sink to even lower lows.
We’ll show you what’s wrong with the rally effort in a moment. Let’s first run through last week’s top economic announcements, and preview what’s coming this week. It was one of these economic data nuggets, in fact, that’s responsible for last week’s last-minute win.
Economic Data Analysis
There were only two data sets of any real interest last week. The first of them was the Institute of Supply Management’s report on manufacturing and services activity. The services index fell a little more than expected, while the manufacturing index surprised most everyone with a reading much higher than the slight rise that forecasters were calling for. Note that the manufacturing index seems to be in full-blown rally mode again after a pretty lousy 2022.
ISM Manufacturing and Services Index Charts

Source: Institute of Supply Management, TradeStation
Last week’s big Kahuna, however, was September’s jobs report posted on Friday. Although the unemployment rate didn’t fall from 3.8% to 3.7% as expected (holding at 3.8%), we saw the addition of 336,000 new jobs last month. August’s payroll growth was also upped from the first estimate of 187,000 to 227,000. The unemployment rate didn’t budge because a bunch of people newly claimed was up, keeping the total number of unemployed people at 6.4 million.
Payroll Growth and Unemployment Rate Charts

Source: Bureau of Labor Statistics, TradeStation
And this report is a key reason why stocks bounced back so well on Friday. Although it took some time for traders to come to this conclusion, rather than fearing that strong jobs numbers might inspire more interest rate hikes, they interpreted it the old-fashioned way… that strong payroll growth indicates a strong economy regardless of what it might mean for interest rates. To this end, interest rates ticked a little higher on Friday, suggesting the market does think the odds of another rate hike are at least decent.
Everything else is on the grid.
Economic Calendar

Source: Briefing.com
This week will continue (or at least rekindle) this discussion. The minutes from the Federal Reserve’s Open Markets Committee most recent meeting will be released on Wednesday, providing a glimpse of what these members might be thinking now. We’ll also hear last month’s consumer inflation data that day, with the producer inflation report for September due on Thursday.
Inflation Rate (Annualized) Charts

Source: Bureau of Labor Statistics, TradeStation
After several month’s of much-needed cooling, inflation rates have been edging higher again since June’s low. Although they’re not looking for accelerated growth now, economists believe we will see more of the same degree of price hikes we’ve seen of late for last month. That opens the door wider to at least one more rate hike this year.
Stock Market Index Analysis
We kick things off this week with a look at the daily chart of the S&P 500, just because there’s so much to unpack there. The biggest of these things, of course, is the way the index pushed up and off of its 200-day moving average line (green) near 4208.
S&P 500 Daily Chart, with VIX and Volume

Source: TradeNavigator
This isn’t surprising. The 200-day line is usually a major battleground line. We could expect the bulls to make a stand there. They just needed the right catalyst. That catalyst was a bullish interpretation to Friday’s strong jobs report.
And the NASDAQ Composite is singing the same basic tune. Although it didn’t find a floor at its 200-day moving average line to push off of (it’s much lower, at 12,581), there does seem to be clear support at 12,998 (light blue, dashed), where the index made lows for a good part of the past couple of weeks.
NASDAQ Composite Daily Chart, with VXN and Volume

Source: TradeNavigator
Just don’t be too quick to jump to bullish conclusions based on Friday’s big gains.
Yes, the market was well up, putting the market back in the black for the week following four weeks of losses. Take a closer look at both daily charts above, however. The NASDAQ Composite’s rally curiously stopped right at its 20-day moving average line (blue) at 13,448. The S&P 500’s high on Friday was 4324 (yellow, dashed)… the level that had been a floor a couple of times since June, but also the peak from the latter part of the previous week. There’s something about this level that traders can’t mentally get past now that the index is below it. Also bear in mind that both of the indexes are under all of their moving average lines except their 200-day moving averages, with the 20-day lines now under the 50-day and 100-day moving average lines.
With that being said, don’t be too quick to doubt this new bullishness has legs. Both the S&P 500 as well as the NASDAQ Composite only had to kiss long-term straight-line support lines last week to start hammering out their recovery gains. This support connects the lows seen in October of last year (December for the composite), March of this year, and now, last week. These lines are dashed on the chart below.
S&P 500 and NASDAQ Composite Weekly Chart
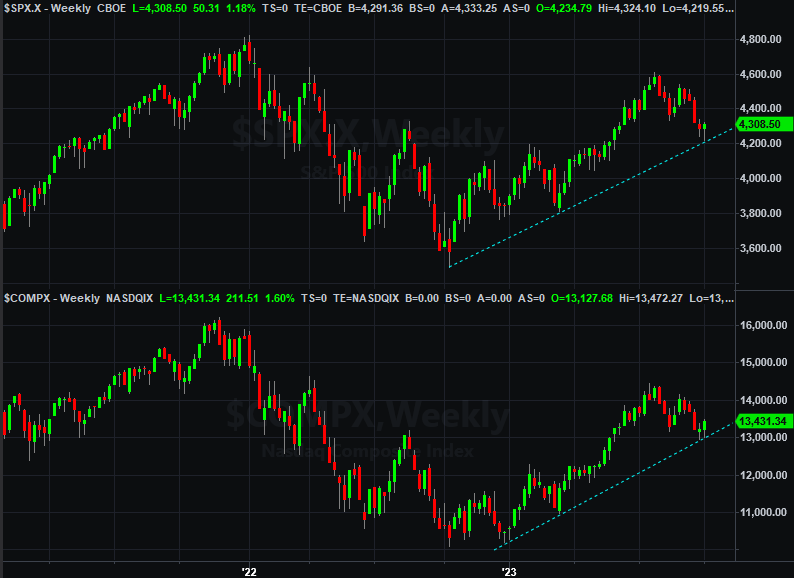
Source: TradeNavigator
The smart-money move to make here is doing nothing other than waiting and seeing how this plays out. This is what rebounds often look like in their beginnings, and there’s no denying the volatility indexes are playing along by virtue of their sizeable dips. There are still too many technical ceilings ahead, however, to truly trust the subtle message being delivered by this recent round of technical action. The economic backdrop isn’t exactly well-suited for driving sustained gains either. Never even mind the fact that both indices are still dangerously close to major technical floors which, if broken, leaves the window wide open to a whole lot more selling.