Weekly Market Outlook - It's Up to the Bears to Prove it Now
It took more than a month to get over the hump, but it finally happened -- the Dow Jones Industrial Average finally cleared the ballyhooed 20,000 mark. Oh, there wasn't a shred of follow-through, but the headlines were plenty dramatic.
 What's next? Good question. While the indices are overbought and stocks are overvalued, that doesn't matter until it does... and it may not matter anytime soon. Political rhetoric is in the driver's seat, and with Trump behind the wheel anything can (and will) happen. As it stands right now though, based on the bigger-picture momentum -- and TrendScore -- the tide is bullish.
We'll weigh what's right and wrong with the rally below, after a quick run-down of last week's and this week's economic news.
Economic Data
There wasn't a lot on the economic dance card last week. But, it was a big week for real estate. We heard December's Existing Home Sales pace as well as last month's New Home Sales pace. The former fell a bit, from 5.65 million to 5.49 million units, but the latter really slumped from 598,000 to 536,000 units sold. Still, the bigger trend is upward in both cases, and the sheer lack of inventory may be holding activity back.
New and Existing Home Sales Charts
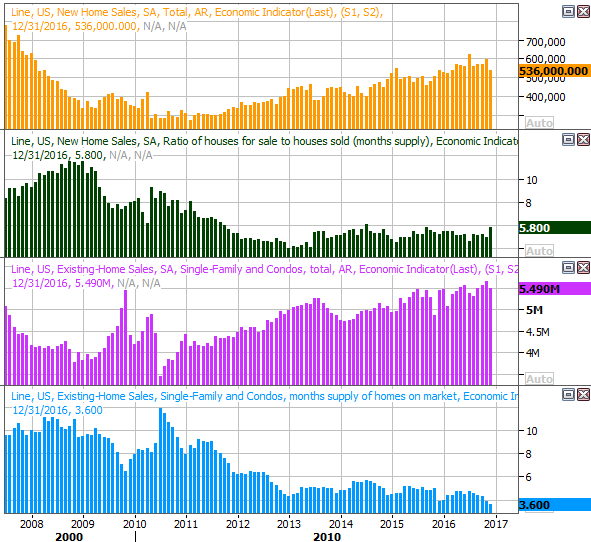
Source: Thomson Reuters
The only other item worth noting from last week (aside from home prices - more on that below) was the preliminary report for the first quarter's GDP growth. Although its subject to change two more times, the first estimate of 1.9% isn't thrilling. Still, it's positive.
GDP Growth Charts
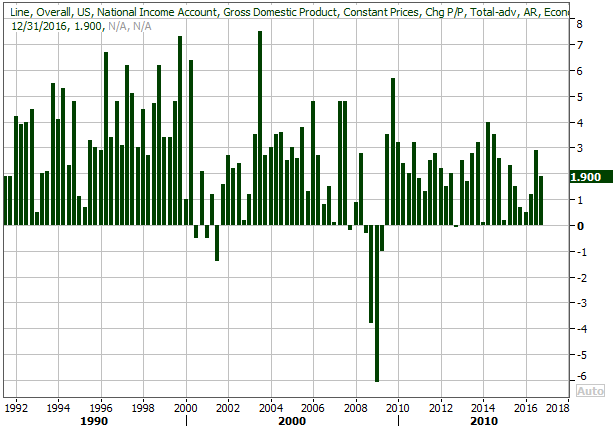
Source: Thomson Reuters
Everything else is on the grid.
Economic Calendar
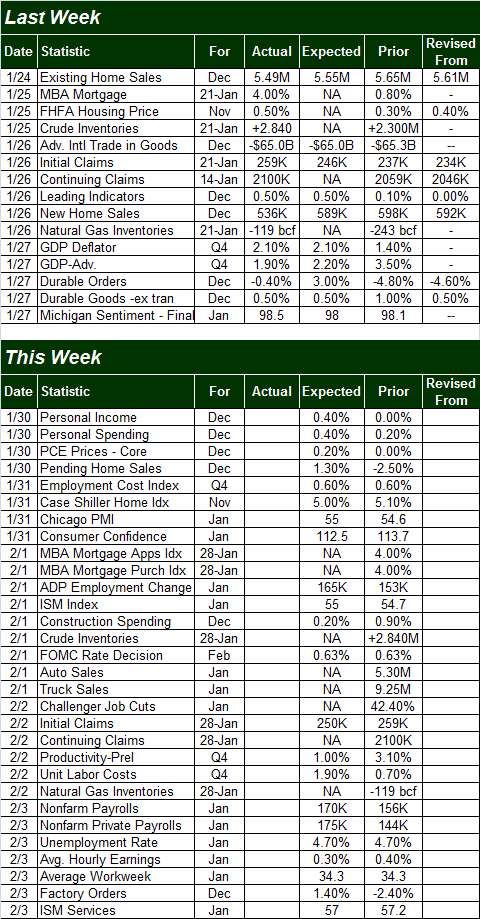
Source: Briefing.com
This week is going to be considerably busier, ending with Friday's grand finale of the employment report for December. Economists expect nonfarm private payroll growth to improve from December's pace of 156,000 to 170,000, although that shouldn't be enough to move the dial on the unemployment rate... which currently stands at 4.7%. The average workweek length should hold steady, and the pros think we're going to see a 0.3% increase (month-to-month) in hourly wages.
Payroll Growth and Unemployment Rate Charts
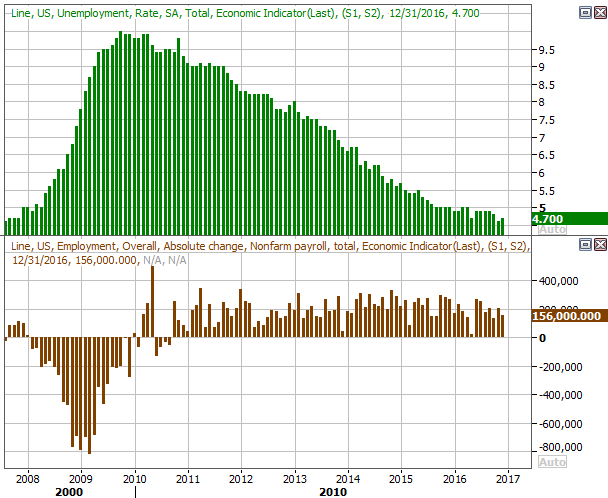
Source: Thomson Reuters
Look for the Case-Schiller Home Price Index on Tuesday, which will round out last week's FHFA Housing Price Index report. The latter was up 0.5% (month-to-month) for November, and the former is expected to rise by 5.0% year-over-year for the same month. This continued appreciation says the real estate market remains firm.
Case-Shiller and FHFA Home Price Index Charts
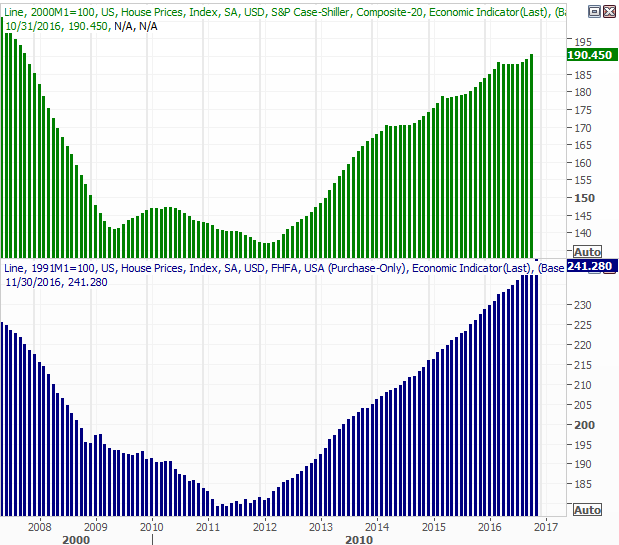
Source: Thomson Reuters
Also look for both ISM indices - service and manufacturing - for January to be released this week. The manufacturing data will be posted on Wednesday, with the services data scheduled for Friday. Both have been and are expected to stay above the critical 50.0 level, though neither is expected to change much from December's levels. Still, this points to a bullish undertow.
ISM Indices Charts
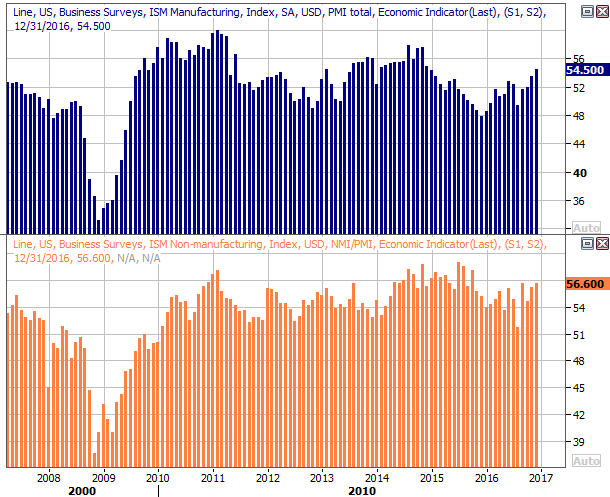
Source: Thomson Reuters
Finally, although there's nothing to chart about it, do know that the FOMC will be making an interest rate decision on Wednesday. The Federal Reserve has already said it intends to increase rates between two and three times this year, but it remains to be seen if it intends to put the next one in place this quickly.
Index Analysis
The market may have finally managed to blast through a major technical ceiling last week, but the follow-through was alarmingly pathetic. So too was the volume behind the surge. Maybe the bulls just needed to catch their breath. Or, maybe the bulls were so stunned it happened they didn't know what to do once it did happen. Whatever the case, we're in somewhat uncharted territory here. Take a look.
S&P 500 Daily Chart
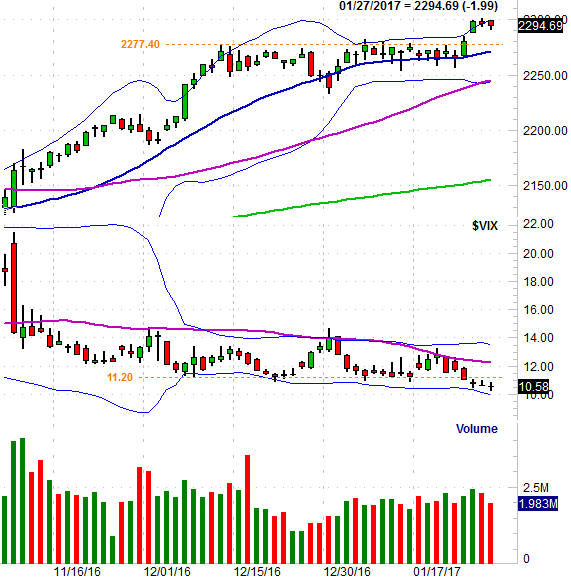
Chart created with TradeStation
Yes, the upper 20-day Bollinger band is part of the equation.
You'll also notice on the daily chart the VIX is at oddly low, multi-year lows. But, you can see just how low that is on the weekly chart of the S&P 500.
S&P 500 Weekly Chart
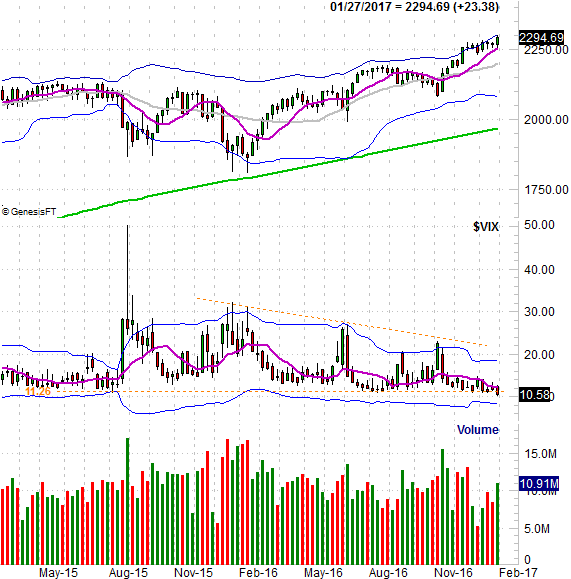
Chart created with TradeStation
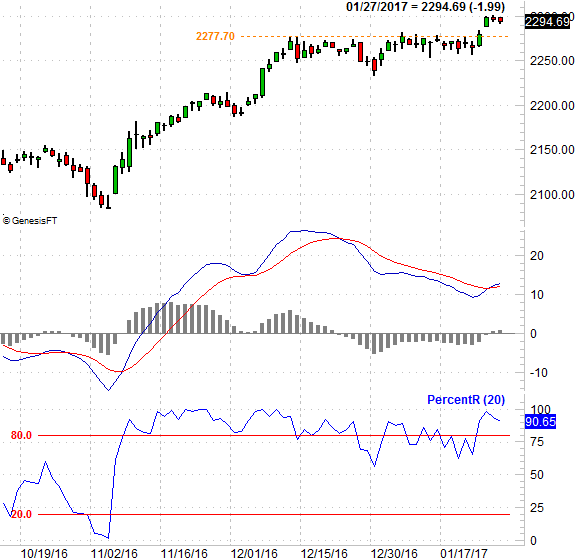
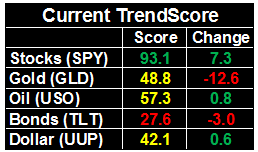
This isn't a question of momentum; there's plenty of that. The BigTrends TrendScore for stocks is currently at 93.1. The question here is measuring the likelihood that the S&P 500 will be able to tack on more gain after rising 10% since early November, and after rallying more than 26% from February's low. Also, the fact that the S&P 500 is now 16.5% above its 200-day moving average line (green) suggests the rally has run a far as it can for the time being.
Whatever the likelihood of a pullback, it's up to the bears to prove there's a reason to expect downside now. The PercentR line is now above 80 (and that buy signal is almost confirmed by a higher high), and the MACD lines are showing a bullish divergence.
S&P 500 Daily Chart, With PercentR and MACD
Chart created with TradeStation
Should a pullback materialize, look for minor support at the 20-day line, at 2270, but the bigger floor to watch is the 2244 level where the 50-day moving average line (purple) and the lower Bollinger band have converged. If that support fails as a floor, there's little else that can hold selloff from dragging the index all the way back to the 200-day line near 2154.
Those are big 'ifs' though.
For what it's worth, although January is usually a good month for stocks, February isn't. The average result for the S&P 500 in January is a 0.79% gain, whereas the February is, on average, a slight loss.... and that's with the benefit of a few very lucky Februarys. That weakness is usually undone in March, but as it stands right now, 2017 is setting up to follow the typical day-to-day path for the market.