Weekly Market Outlook – It’s Tough to Trust the Stock Market After Best Week of the Year
Wow. What a week! The S&P 500 rallied 6.0% over the course of the past five trading days, marking the index’s best week since June… of 2022. The bulls didn’t even hesitate to sharply and decidedly reverse the downtrend well underway the week before.
As the old adage goes though, if it seems too good to be true, then it probably isn’t. And there’s certainly plenty of reason to doubt any follow-through is in the cards.
We’ll look at what’s not-quite-right about this big gain in a moment. Let’s first work through last week’s biggest economic announcements that included the so-so jobs report that investors quietly wanted.
Economic Data Analysis
We heard a good deal of economic news last week, but before we get to any of it we should preface everything by pointing out the vast majority of it was tepid… exactly what traders wanted, so the Federal Reserve wouldn’t impose another rate hike. And, it didn’t. The economy is cooling off just enough to conclude inflation is under control. That’s a big part of the reason stocks did so freakishly well last week.
That being said, there is a handful of data to review. For instance, home prices continue to climb (albeit at a welcomed, slower pace). The numbers are only through August and could have changed in the meantime, but as of two months ago the Case-Shiller Index as well as the FHFA Home Price Index trekked higher at a shallower pace. The Case-Shiller measure in particular hints that higher rates and waning demand may finally be taking a toll on prices, although it’s still far too soon to assume values are on the verge of a major decline.
Home Price Charts
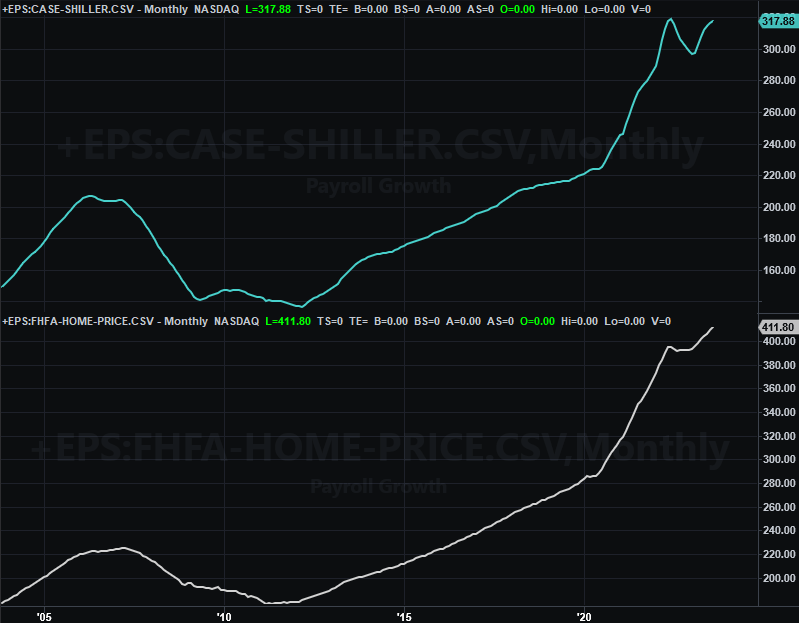
Source: Standard & Poor’s, FHFA, TradeStation
Sentiment also continues to deteriorate (perhaps a byproduct of lingering inflation). The Conference Board’s consumer confidence score slipped from September’s reading of 104.3 to near a multi-month low at 102.6. The University of Michigan’s sentiment index is moving in the same direction… down. This isn’t good for the market. Just bear in mind these scores were collected before last week’s big gain.
Consumer Sentiment Charts
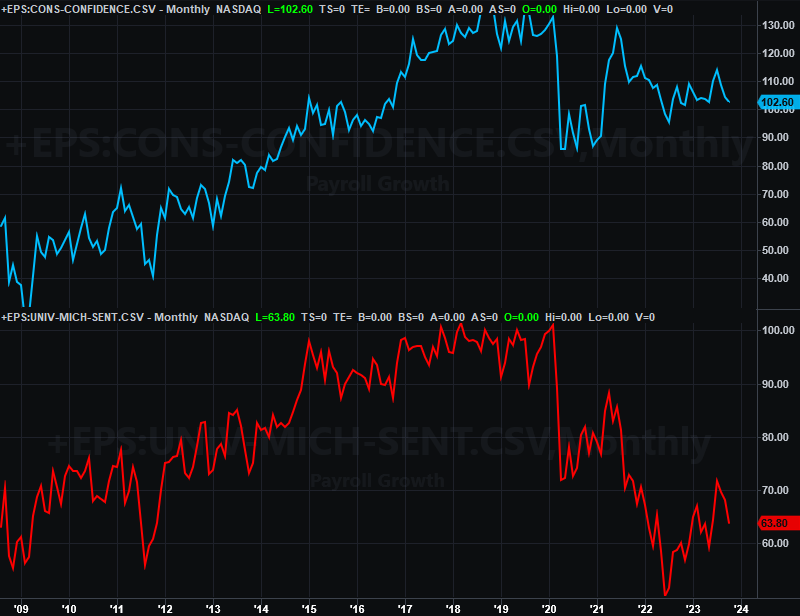
Source: Conference Board, University of Michigan, TradeStation
We also got news from the Institute of Supply Management last week. October’s services index stumbled after hinting at a rebound, while the manufacturing index just cratered after an even strong bullish headfake.
ISM Services, Manufacturing Index Charts
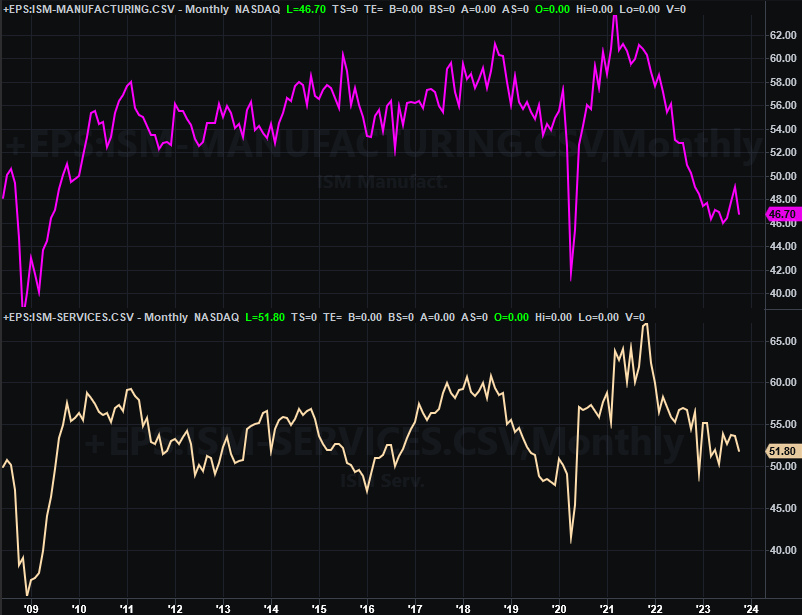
Source: Institute of Supply Management, TradeStation
One bad month isn’t fatal. All downtrends start with that one first ugly month though. This data set will be worth watching closely from here.
Finally, on Friday we got last month’s jobs report. Payroll growth of 150,000 jobs was a bit lower than forecasts of 170,000. Moreover, September’s job growth of 297,000 is a downward revision from the previous estimate of 336,000. It was just enough to ratchet up the unemployment rate of 3.8% to 3.9% for October.
Unemployment Rate, Payroll Growth Charts
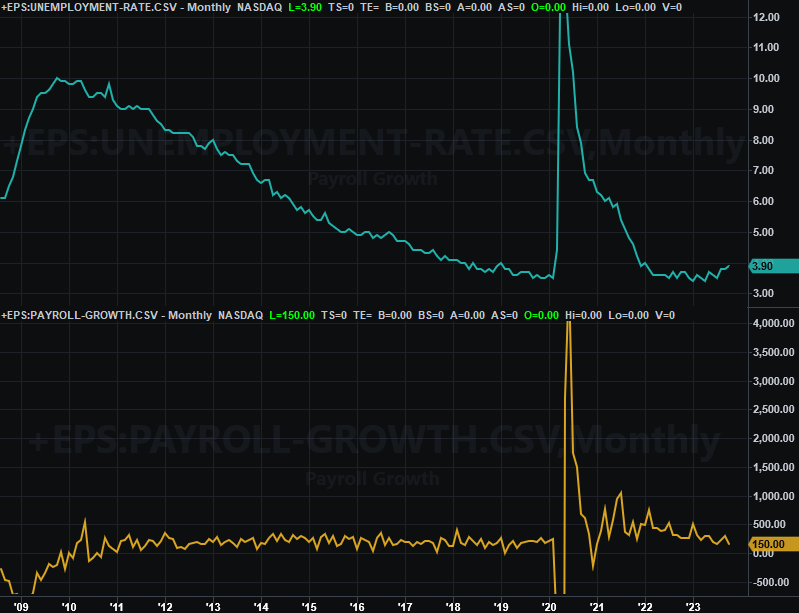
Source: Bureau of Labor Statistics, TradeStation
Notice that payroll growth continues to slow down, and that the unemployment rate continues to inch higher. These are slow, grinding trends, perhaps beat into place by the aforementioned lingering inflation. Either way, these work against the economy… arguably more than the cessation of interest rate hikes works for it.
Everything else is on the grid.
Economic Calendar
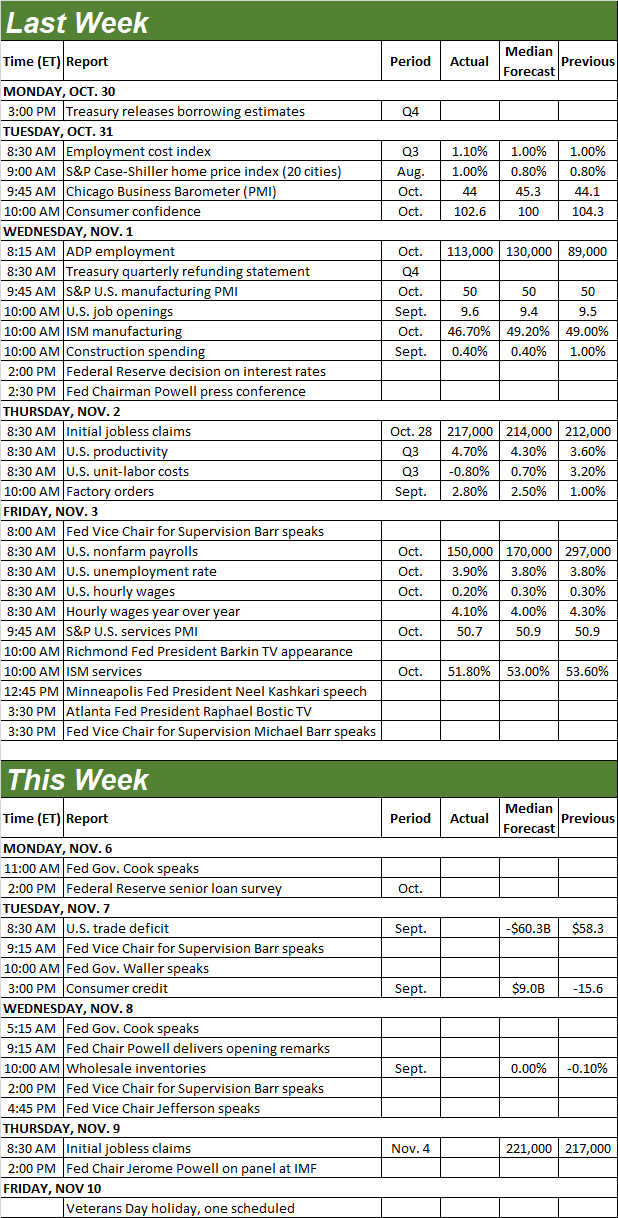
Source: Briefing.com
There’s nothing heavy-hitting this week other than a bunch of speeches from the Federal Reserve’s governors… and there are a bunch of them to be sure. They could move the market, although not likely as much as it’s been moving on its own of late.
Stock Market Index Analysis
If it seems like last week’s bullish romp came out of nowhere, you’re not crazy. It did. All the major market indexes had broken all of their key technical support levels just the week before. Then a little bit of (perfectly reasonable) hope on the interest rate front turned things around, leading to the best week in many, many months.
And yet, it’s still a difficult move to trust there’s more of the same ahead.
Take a look at the daily chart of the S&P NASDAQ Composite to see why. Yes, the sheer scope and size of the gain is a tough act to follow. That’s not the only worry though. Also notice the composite stopped rallying right as it touched the falling resistance line (yellow, dashed) that’s connected all the key highs since July’s peak. It also stopped short of the 100-day average line (gray) at 13,619.
NASDAQ Composite Daily Chart, with VXN and Volume
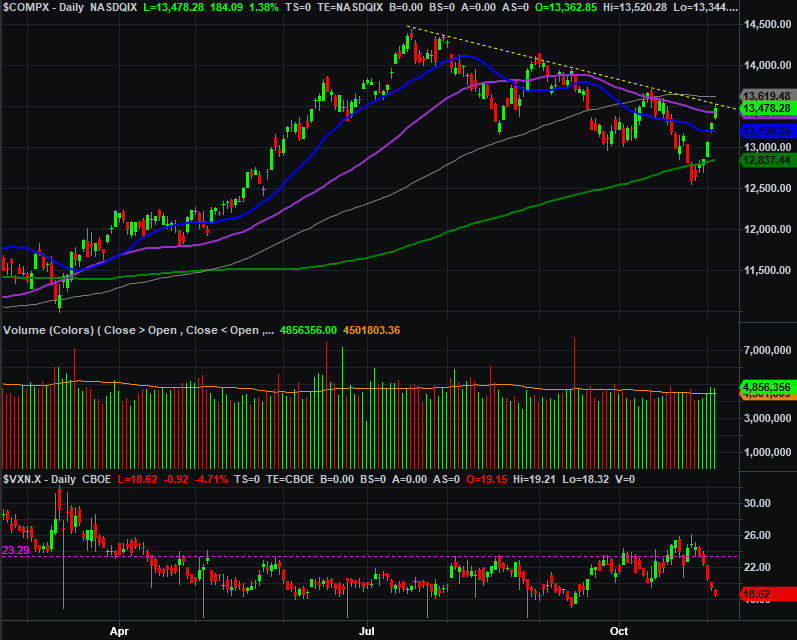
Source: TradeNavigator
Still, you have to respect the fact that the NASDAQ managed to clear its 50-day moving average line (purple) at 13,452.
The S&P 500 did the same, hurdling its 50-day line (purple) at 4,351. Notice the S&P 500 also, however, didn’t move above its 100-day moving average line (gray) at 4,403, where a bunch of other technical resistance levels are converging. That narrow zone is going to be tough to get past.
S&P 500 Daily Chart, with VIX and Volume
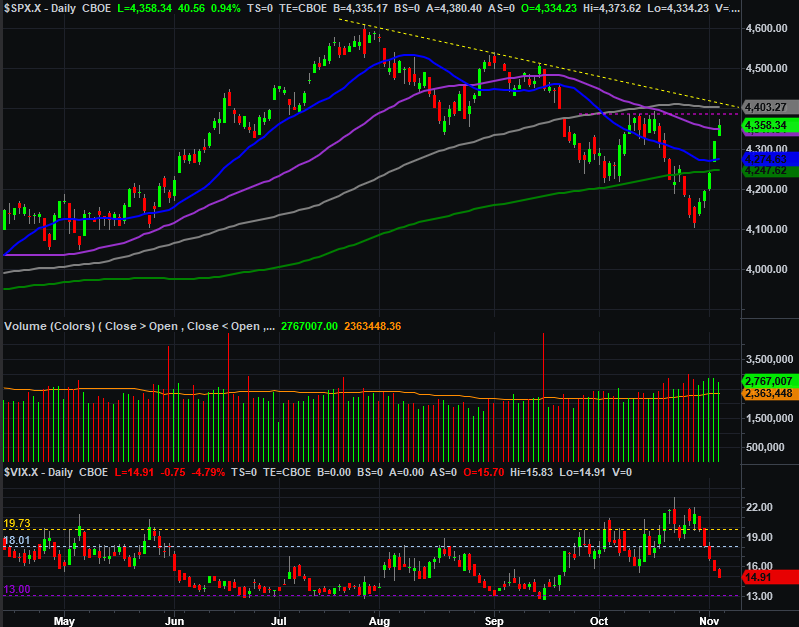
Source: TradeNavigator
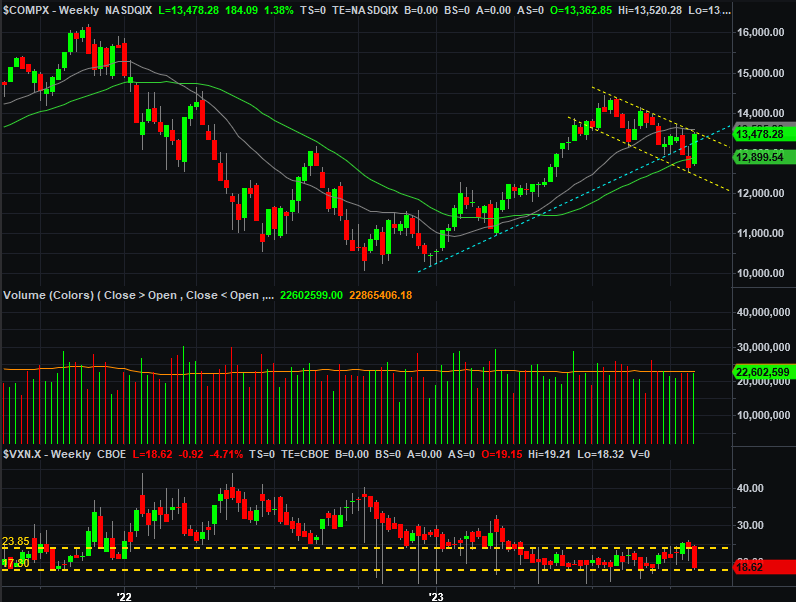
Here’s the weekly chart of the NASDAQ Composite for some visual perspective on just how big last week was. It was clearly crazy, jolting the market out of its downtrend. Still, it’s too soon to call this a full-blown breakout that’s going to keep chugging higher.
NASDAQ Composite Weekly Chart, with VXN and Volume
Source: TradeNavigator
This is a situation where the smartest move may be doing nothing until it’s clear the market has settled down. Bulls are currently blinded by the fear of missing out, while the bears are blinded by disbelief. Neither is where you want to be in your head. Last week’s big jump is seemingly too good to last. But, never say never. Let’s just wait and see if the crowd remains this bullish when they’re actually tested. That could take a couple of weeks to administer and then complete the test.
That might be the ideal unfurling of the situation though… at least for the bulls. There’s every reason to expect the usual year-end bullishness this year. The thing is, it’s not really supposed to start in earnest until the middle/latter part of this month.
Also working against more bullishness straight ahead is that the NASDAQ Composite’s Volatility Index (VXN) -- as well as the S&P 500’s -- is back at a key floor near 18.0 right now. That’s not necessarily fatal. As you can see, the NASDAQ rallied for a while after the VXN fell to this level in May. But, the situation usually turns into trouble for the market sooner than later (as became the case in July).