Weekly Market Outlook – Here Comes the Santa Claus Rally

Another week, another win. That makes the eighth in a row, and while last week’s wasn’t as big as the one from the week before, it was still sizeable. The cup-and-handle breakout thrust from two weeks back is still underway.
There are some red flags starting to wave though. For instance, Wednesday’s selloff was the biggest single-day loss suffered since the rally began back in late October. It bounced back the next day… this time. But, it was an uncharacteristic move. The volume behind the bounceback was on the thin side as well. Things could still go either way here.
We’ll look at how and why in a moment. Let’s first look at last week’s biggest economic announcements and preview what’s coming in this holiday-shortened week.
Economic Data Analysis
The busy week started on Tuesday with last month’s housing starts and building permits. They were ok, even if not thrilling. Permits slipped a little, from 1.5 million to 1.46 million, and are still relatively low. Starts surged to a multi-month high pace of 1.56 million though, trouncing expectations.
Housing Starts and Building Permits Charts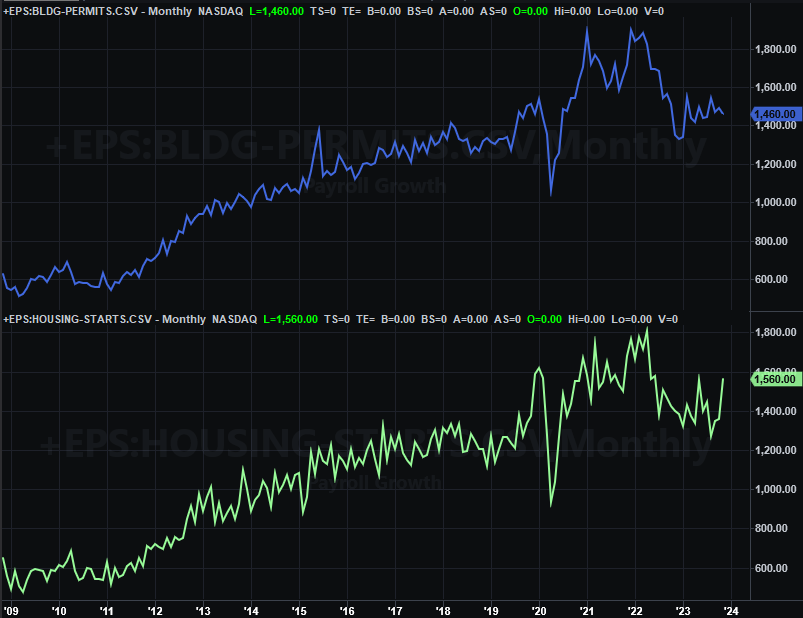
Source: Census Bureau, TradeStation
It’s too soon to read much (if anything) into this big improvement. Permits didn’t match the move, and homebuilder confidence remains rather anemic. In this vein…
Last month’s sales of existing houses more or less matched October’s pitiful numbers, while sales of new home fell -- again -- from 672,000 to a 15-month low of 590,000. The argument that consumers are buying new homes because too few homes are on the market just doesn’t hold water any longer. People just aren’t buying any homes like they were just a couple years back. Higher interest rates likely have a lot to do with that. (More on home prices in a moment, below.)
Home Sales Charts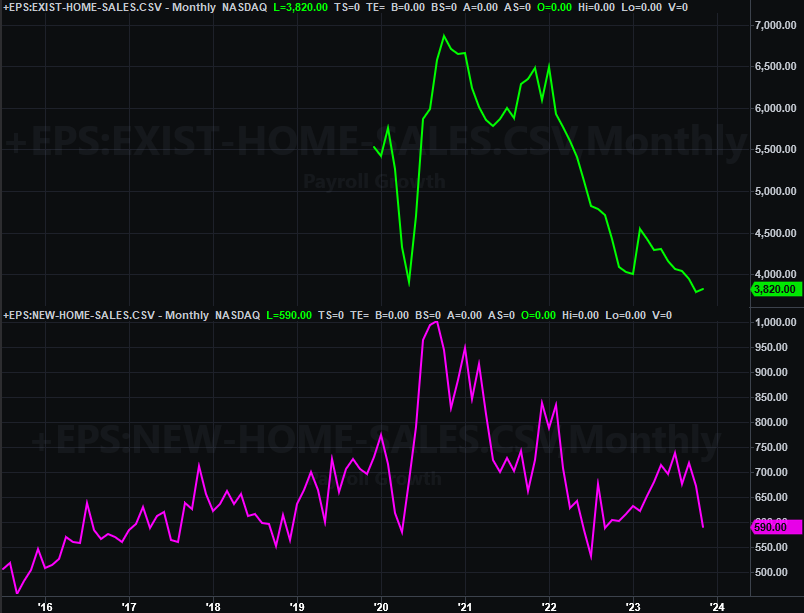
Source: National Association of Realtors, Census Bureau, TradeStation
It was also a big week for sentiment measures. The Conference Board reports consumer confidence ticked a little higher in December, but only a little. Meanwhile, the third and final look at the University of Michigan’s sentiment index for this month says consumers are feeling as pessimistic as they’ve felt since the middle of this year. And, this pessimism is growing.
Consumer Sentiment Charts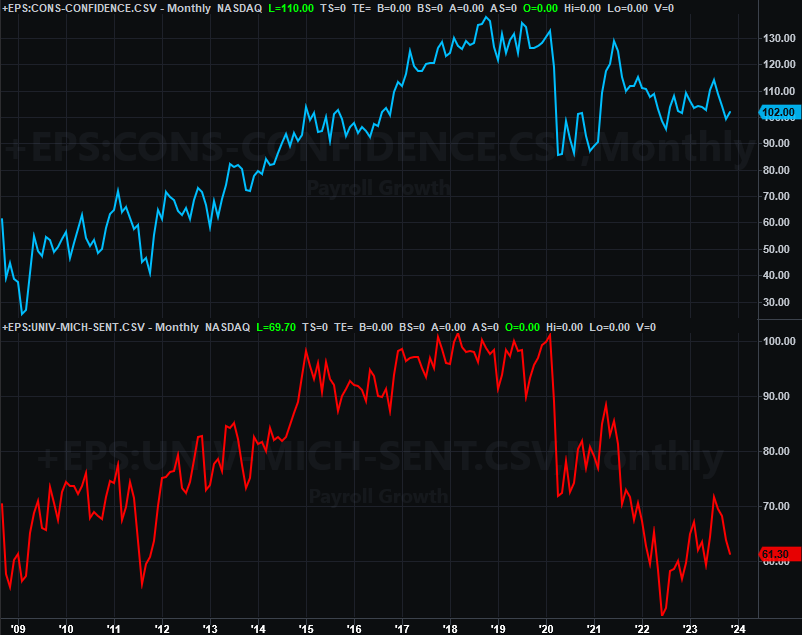
Source: National Association of Realtors, Census Bureau, TradeStation
Also, there’s no chart of it shown here, but do know that last month’s consumer incomes grew a little more than expected, while spending came in a bit less than expected. Broadly speaking, this suggests inflation continues to cool off. This is an important data nugget, as the Federal Reserve considers this information over raw inflation numbers when making decisions regarding interest rates.
You’ll also want to note Q3’s GDP growth estimate was dialed back from 5.2% to 4.9%. That’s not a fatal blow, but it does suggest -- or confirm -- we may have been overestimating the economy’s actual strength right now.
Everything else is on the grid.
Economic Calendar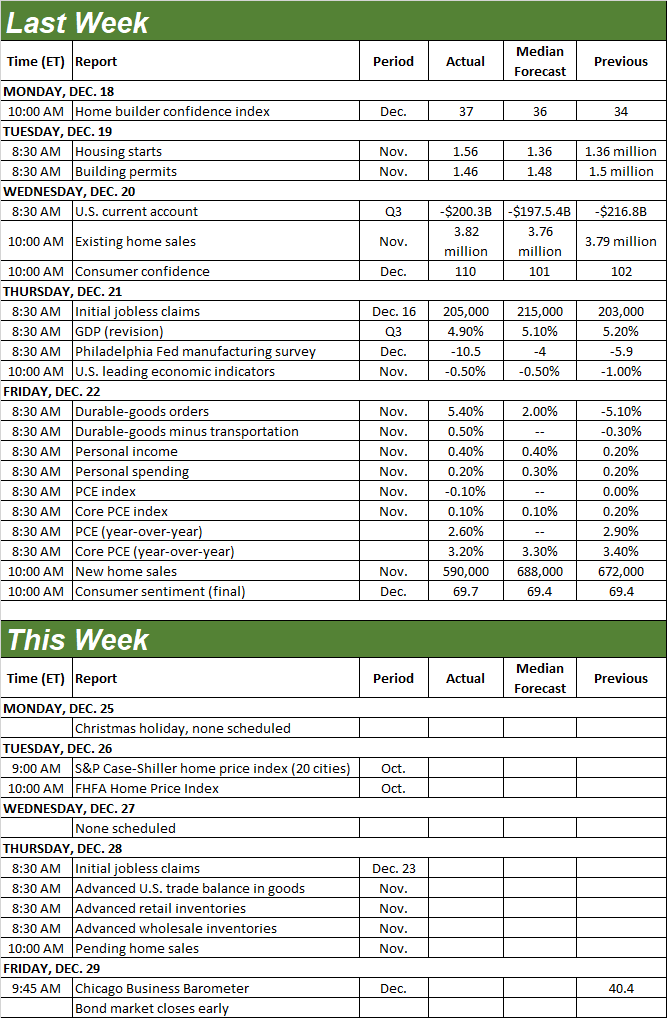
Source: Briefing.com
The only reports of interest scheduled for this week both have to do with real estate, and both are coming on Tuesday. That’s the Case-Shiller Home Price Index for October, and the FHFA Housing Price Index for the same month. Both have continued to show surprising resiliency, although the Case-Shiller index is also clearly slowing down.
Home Price Index Charts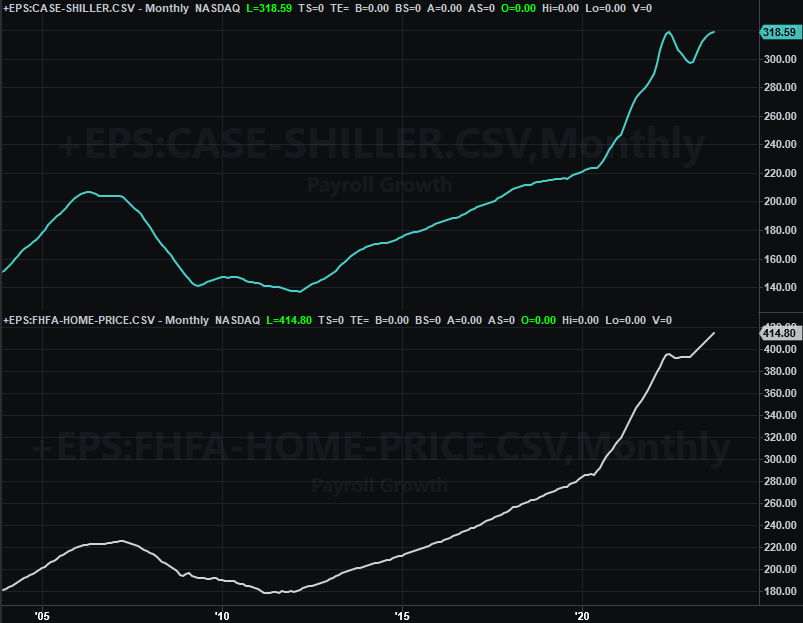
Source: FHFA, Standard & Poor’s, TradeStation
It will be interesting to see how long home prices can hold up when sales are struggling and at least permits are falling as well. A sheer lack of supply may be the only thing keeping values propped up right now.
Stock Market Index Analysis
The weekly chart of the S&P 500 below says it all. The index broke above its technical ceiling around 4,600 two weeks ago, and put some more distance between it and itself last week. The early-2022 peak (the peak made right before last year’s bear market) is the next prospective problem, and it’s now within sight. The usual Santa Claus rally could get us there, and perhaps even beyond that potential resistance level.
S&P 500 Weekly Chart, with VIX and Volume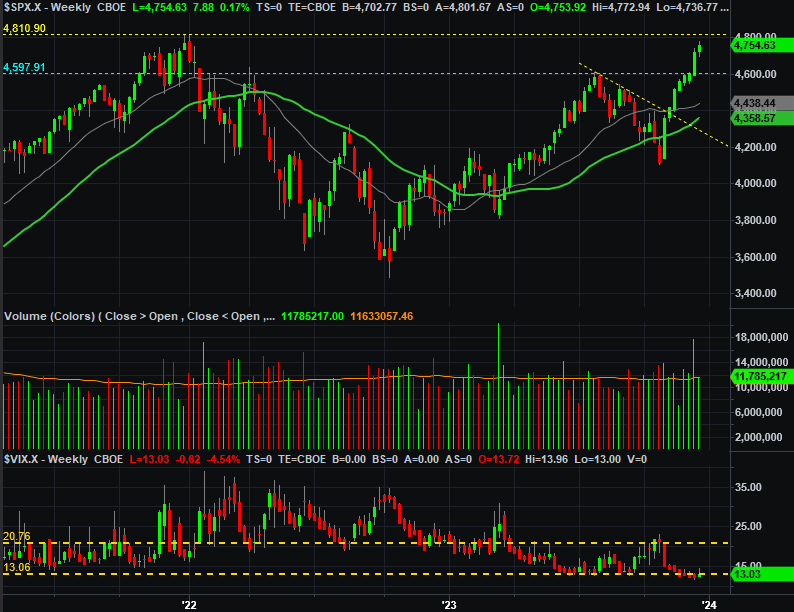
Source: TradeNavigator
The weekly chart of the NASDAQ Composite looks similar, but not quite identical. Like the S&P 500, the composite hurdled its major resistance level at 14,439 two weeks ago, and continued chugging higher last week. Not quite like its S&P 500 counterpart, however, the NASDAQ is still well away from testing its pre-bear-market peak of 16,175 hit in November of 2021.
NASDAQ Composite Weekly Chart, with VXN and Volume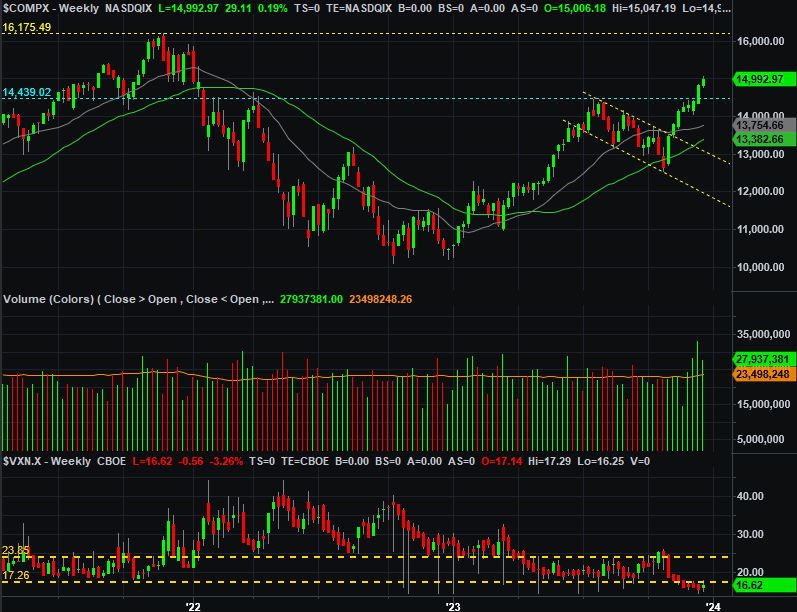
Source: TradeNavigator
It doesn’t exactly matter…. maybe. The tech-heavy NASDAQ Composite fell more during last year’s bear market, and is starting its recovery effort from a (relatively) lower mark. The index’s weighting structure also changed in the interim in a way that makes it tougher for the biggest names -- like the so-called “Magnificent 7” -- to lead the index higher as much as they led it lower. And, sometimes indexes just don’t perfectly mirror one another.
Nevertheless, the NASDAQ is the index that bulls want to see leading the rally, and the index the bulls want to see clearing major technical hurdles first. When it’s lagging, it suggests some broad hesitancy that might mean more than it seems on the surface.
Here’s the daily chart of the S&P 500 for a little added detail. Note that Wednesday was brutal. The market started to recover the very next day. It never quite tested Wednesday’s high again though. Maybe that’s because traders are suddenly a bit gun-shy. Or, maybe it was just the approaching holiday that had people thinking about and doing other things.
S&P 500 Daily Chart, with VIX and Volume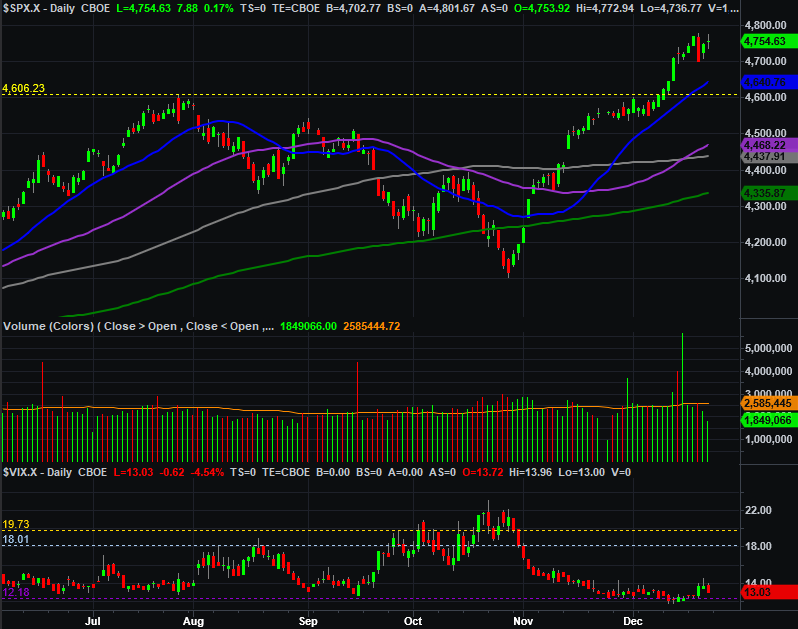
Source: TradeNavigator
Ditto for the NASDAQ Composite’s daily chart. Notice that the composite isn’t as far above its 200-day moving average line (green) now as it was back in July. This makes sense, given that the NASDAQ isn’t nearly as close to hitting its pre-bear-market peak as the S&P 500 is. (To this end, notice the S&P 500 is as far above its 200-day moving average line now as it was in the middle of the year.)
NASDAQ Composite Daily Chart, with VXN and Volume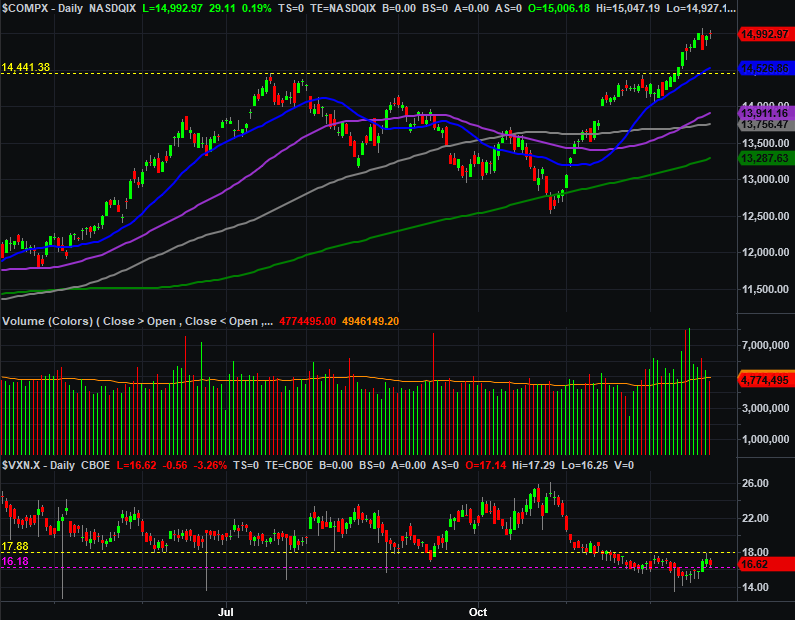
Source: TradeNavigator
Trading is always a guessing game, but it’s even more of one right now. There just aren’t a lot of meaningful clues and cues to feed off of right now. We’ll presume bullishness remains in store, partially because the momentum is bullish, and partly because of the calendar. We’re likely to start the new year on the same bullish foot as well.
After that though, the sheer weight of the gains since October’s low starts to become a problem. It seems unlikely there will be much more bullish gas left in the tank to keep the rally going. We’ll look for some profit-taking pressure at that point. Only time will tell where it might find support should we see that happen. The good news is, there’s plenty of potential support levels in position -- or en route -- starting with the indexes’ 20-day moving average lines (blue).