Weekly Market Outlook - Friday's Wound is Even Worse Than It Seems
The bulls took their shot at turning things around last week. When push came to shove, though, it was the bears doing all the shoving. Stocks just logged their lowest weekly close since June of last year, with the buyers overwhelmed by the sheer momentum of the selling. The pullback crossed some major technical support lines in the process.
And yet, none of those details is the biggest red flag from last week. The chief worry now is much more obscure, yet much more meaningful.
We'll look at that matter in some detail below, as we always do. First, however, let's look at last week's most important economic news and preview what's in the lineup for this week.
Economic Data Analysis
There was only one data nugget of any real interest dished out last week, and we didn't even get the whole nugget. We only got half the nugget. That's inflation; last week's report only gave us the consumer side of the picture. But, it was enough to paint a grim one. The overall consumer inflation rate now stands at (annualized) 7.9%, and at 6.4% on a core (ex-food and ex-gas) basis. Both are multi-decade highs.
Inflation Rate Charts
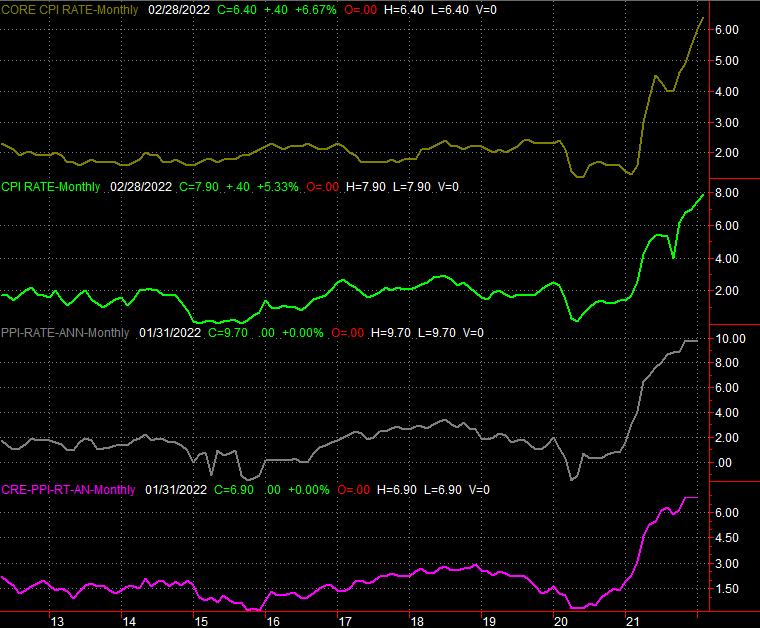
Source: Bureau of Labor Statistics, TradeStation
We'll get the producer inflation figures for February on Tuesday of this week, but don't look for any encouragement or relief. Economists are calling for just as much rampant pricing on the backside of the economy as well.
This of course underscores the likelihood that the Federal Reserve is going to raise the Fed Funds Rate on Wednesday, when it's scheduled to make such a decision. As of the latest look at interest rate futures, traders are pricing in a 995% chance of a quarter-point hike.
Everything else is on the grid.
Economic Calendar
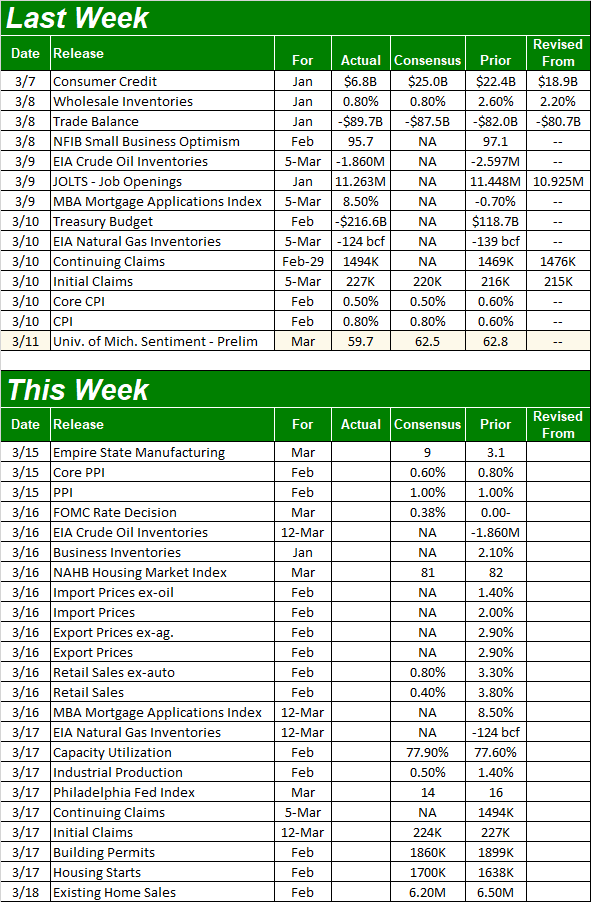
Source: Briefing.com
In addition to the second half of last month's inflation report, this we'll also get a look at last month's retail spending. You may recall January's sharp recovery from December's (relative) lull. Economists don't think we'll see a repeat of that growth, but they are forecasting solid forward progress with or without cars.
Retail Sales Charts
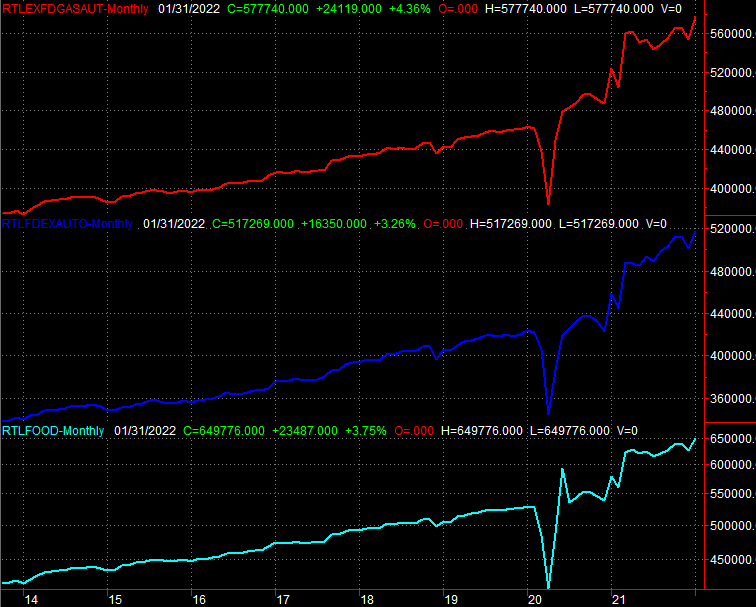
Source: U.S. Census Bureau, TradeStation
On Thursday keep your eyes peeled and your ears open for February's capacity utilization and industrial productivity report. Once again forecasters are modeling a slowdown from January's figures, but January as a great month, and progress is progress.
Capacity Utilization and Industrial Productivity Charts
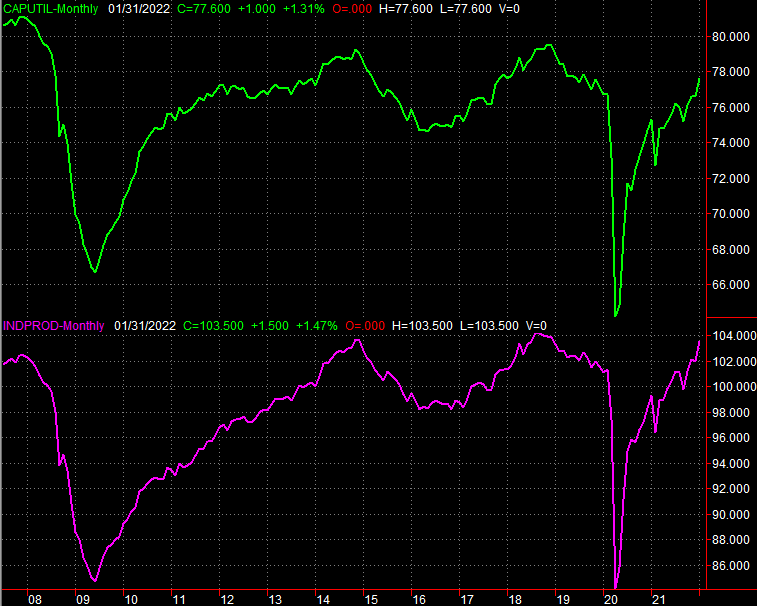
Source: U.S. Census Bureau, TradeStation
Also on Thursday we'll get last month's housing starts and building permits numbers. The former is expected to curb a little, and the latter is expected to advance a little. In both cases though, the bigger trend is still a bullish one.
Housing Starts and Building Permits Charts
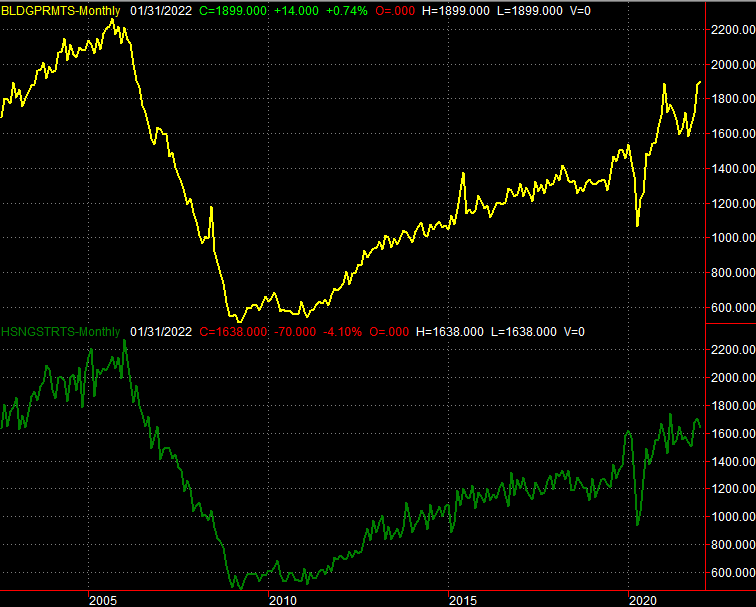
Source: U.S. Census Bureau, TradeStation
Finally, on Friday brace for February's sales of existing homes. We saw a healthy uptick in January's annualized pace, though economists believe we hit something of a headwind last month.
New and Existing Home Sales Charts
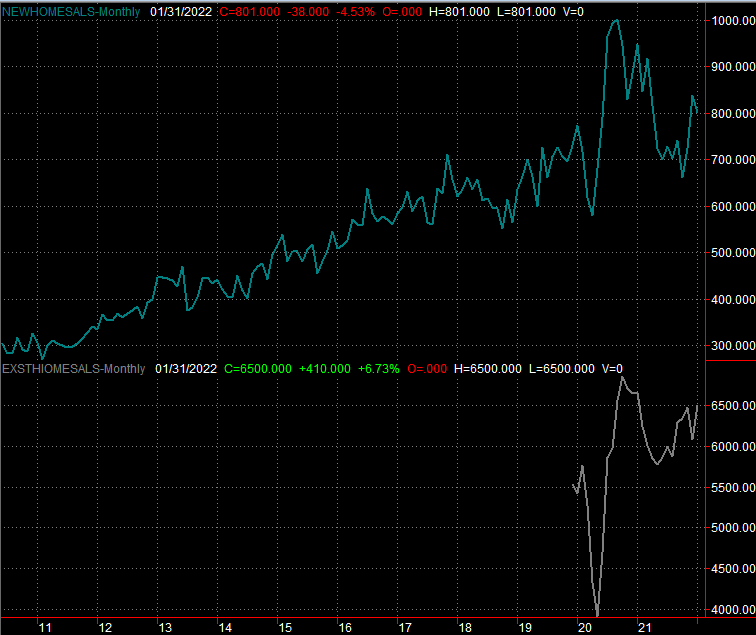
Source: U.S. Census Bureau, National Association of Realtors, TradeStation
New home sales figures for February will be posted next week. We don't yet know what forecasters are thinking, but it's not too soon to start thinking about the collective impact of sky-high home prices and rising interest rates. We may finally be at a turning point.
Stock Market Index Analysis
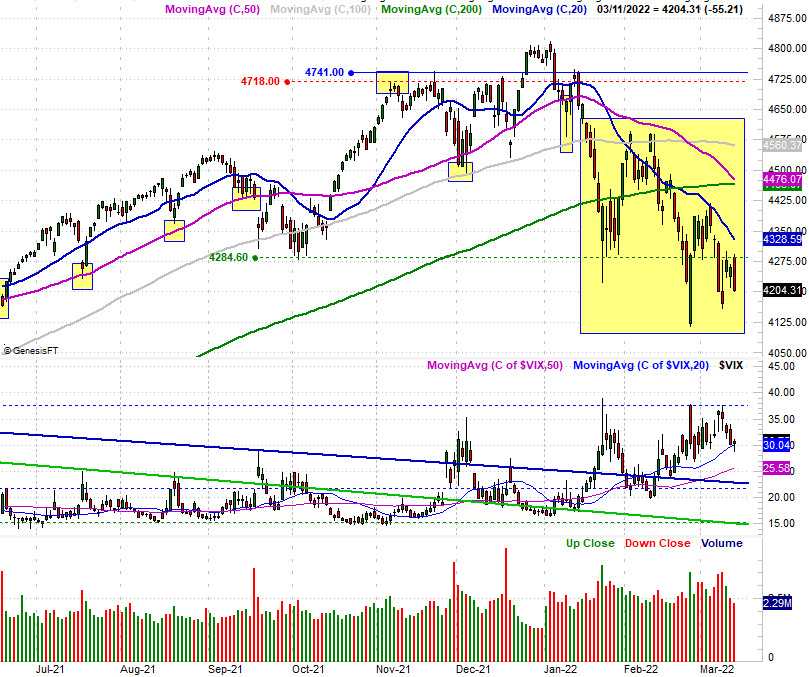
We kick this week off with a look at the weekly chart of the S&P 500, as it's from this vantage point we can see the serious trouble the market slipped into last week. Namely, the index broke under a major technical support level at 4270 to log its lowest close since June. And, it's just as clear in this timeframe that the 50-day moving average line (purple) has now crossed under the pivotal 200-day moving average line (green). Both are signs of trouble.
S&P 500 Weekly Chart, with VIX and Volume
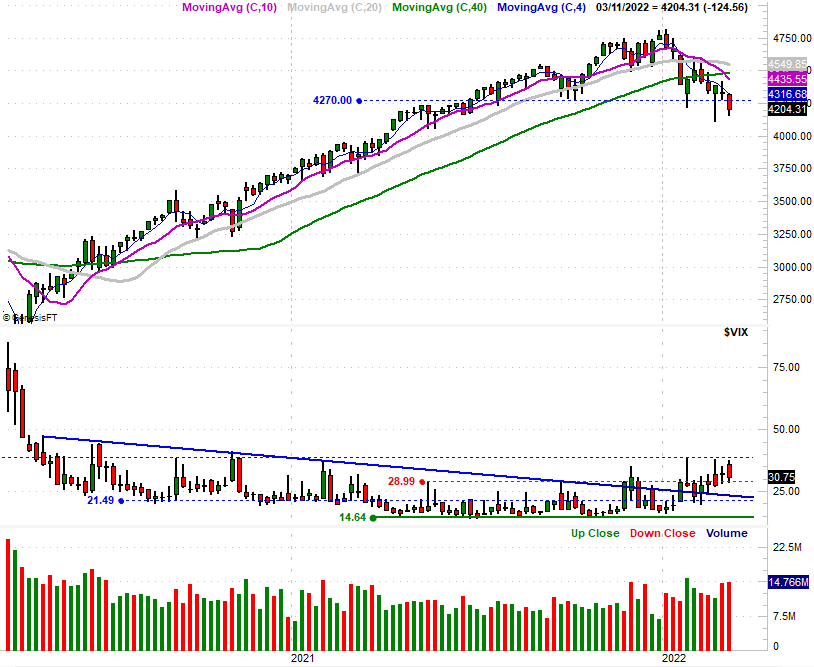
Source: TradeNavigator
The weekly chart also shows us how the VIX tested its ceiling at 39.0, though it didn't move above it... at least not yet.
The weekly chart of the NASDAQ Composite is in a similar -- though not identical -- situation.
Yes, the composite broke under a somewhat significant floor at 13,105. It did NOT, however, move under the 38.2% Fibonacci retracement lime at 12,566 that was established as a prospective floor in mid-2021 before the Fibonacci retracement endpoints could have even been established. Also notice how that level temporarily served as a floor in early February following the initial blow to the market.
NASDAQ Composite Weekly Chart, with VXN
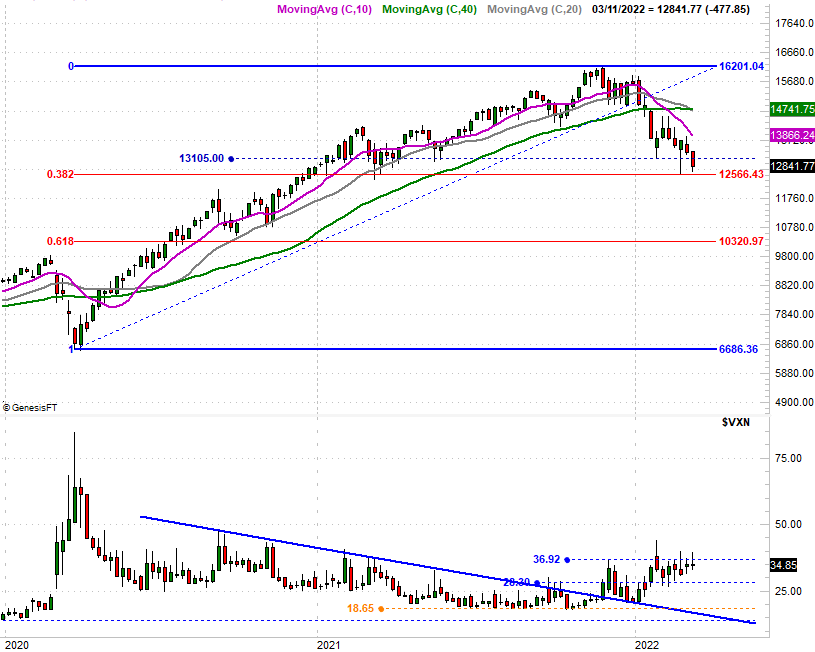
Source: TradeNavigator
Until that support at 12,566 snaps and the Nasdaq Volatility Index (VXN) actually breaks above its ceiling at 36.9, don't get too presumptuous about this pullback going any farther. Also be prepared for the possibility that the selloff to-date has been so strong that we might get a short-lived dead-cat bounce that doesn't actually go anywhere.
Zooming into the daily chart of the S&P 500 gives us a little more detail about the index's lines in the sand, but doesn't actually shed any more light on the disposition of its current downward momentum. It does tell us, however (and this is suspicious), the losses suffered on Thursday and Friday don't necessarily reflect the majority opinion. Volume was relatively light on both days. Then again, it's likely that anybody wanting out was already out by then.
S&P 500 Daily Chart, with VIX and Volume
Source: TradeNavigator
Perhaps most important about the daily chart is that it confirms the 20-day moving average line (blue) currently at 4328 is still in play as a technical ceiling. In a similar fashion, the VIX's 20-day moving average line (blue) at 30.0 is also now acting as a technical floor... at least on Friday.
Ditto (almost exactly) for the daily chart of the NASDAQ Composite.
NASDAQ Composite Daily Chart, with VXN
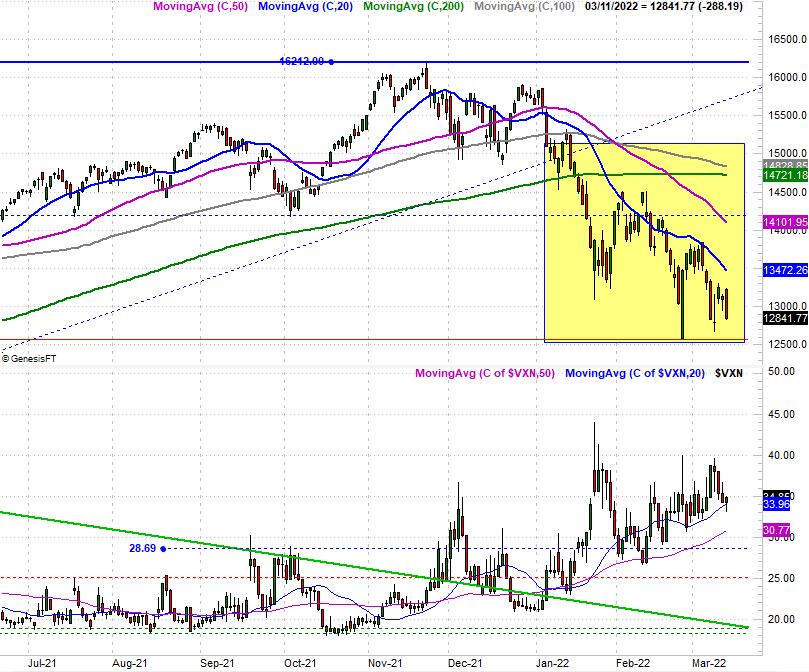
Source: TradeNavigator
Also note that for the S&P 500 as well as the NASDAQ that Friday was an outside day, meaning the open was above Thursday's high, yet the close was above Thursday's low. This sudden, sweeping intraday reversal generally indicates a major change of heart in how investors feel, so much so that the undertow could last for some time. The conflict in Ukraine is of course a key part of the reason for the swing, and remains a major unknown. By and large though, uncertainty works against the market rather than for it. As long as that military action presents the possibility of expanding outside of that country's borders, no investor is going to dig in too deep.
Just keep an eye on all the aforementioned lines in the sand, and resign yourself to the fact that geopolitical instability is going to push and pull stocks in an unexpected direction nearly every single day for the foreseeable future.