Weekly Market Outlook – Already Running Out of Gas?
Stocks may have logged their third winning week in a row last week. But, it was hardly a decisive victory. The effort was losing steam on Friday, and for that matter, none of last week’s daily gains had a great deal of gusto. Namely, the volume behind the advance since October has never been convincing, but it was outright deteriorating as last week wore on.
We’ll look at the matter in some detail in a moment. Let’s first look at last week’s little bit of noteworthy economic news and then preview what’s coming this week.
Economic Data Analysis
A week ago we weren’t anticipating any economic news worth featuring this week. Then we got thrown a curveball. The University of Michigan’s first look (of three) at consumer sentiment readings for the month of May fell quite a bit. It’s NOT showing up on the chart below, but the sentiment score of 67.4 is a six-month low. Notice that the dip also follows April’s measurable dip in the Conference Board’s consumer confidence reading. Clearly something’s chipping away at peoples’ psyches here. It’s not been a problem for the market just yet, but it could become a problem for stocks if it lingers.
Consumer Sentiment Charts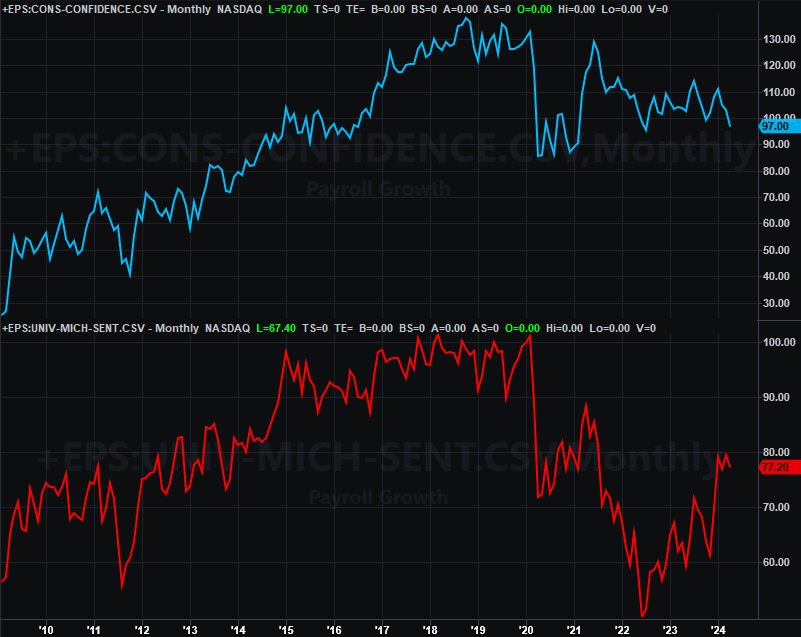
Source: University of Michigan, Conference Board, TradeStation
Just keep in mind this is only the first of three readings the University of Michigan takes of consumer sentiment every month. It could change for the better between now and the end of May.
Everything is on the grid.
Economic Calendar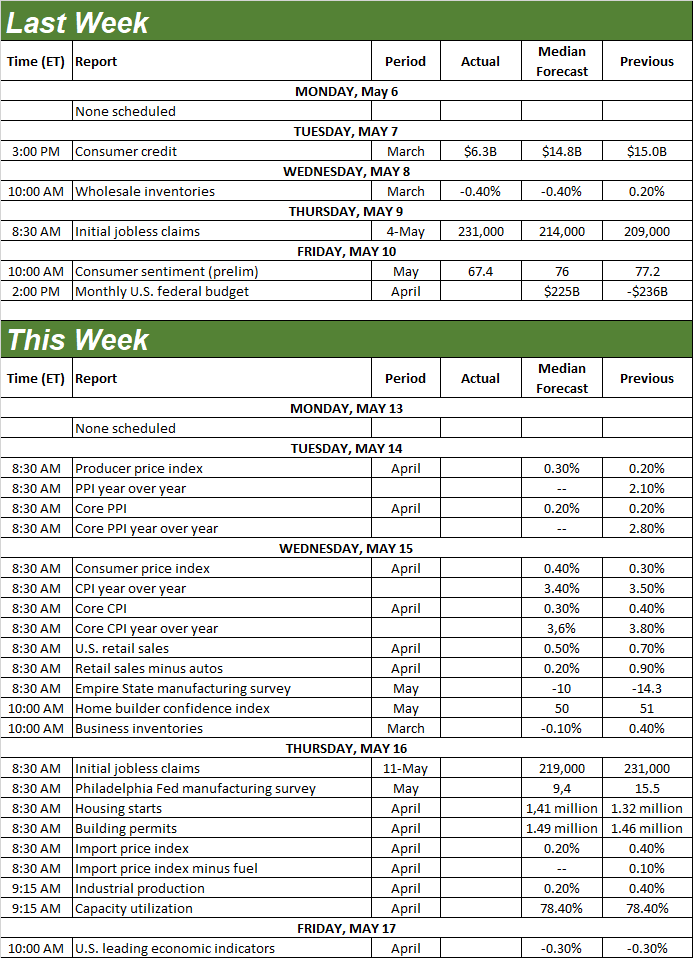
Source: Briefing.com
This week’s going to be a rather busy one.
The party starts on Tuesday with a look at last month’s producer inflation report, followed on Wednesday by April’s consumer inflation data. Most every stratification of inflation has actually started to tick higher lately, without ever sliding all the way back to the Fed’s target levels. It doesn’t appear this has changed in the meantime.
Producer and Consumer Inflation Charts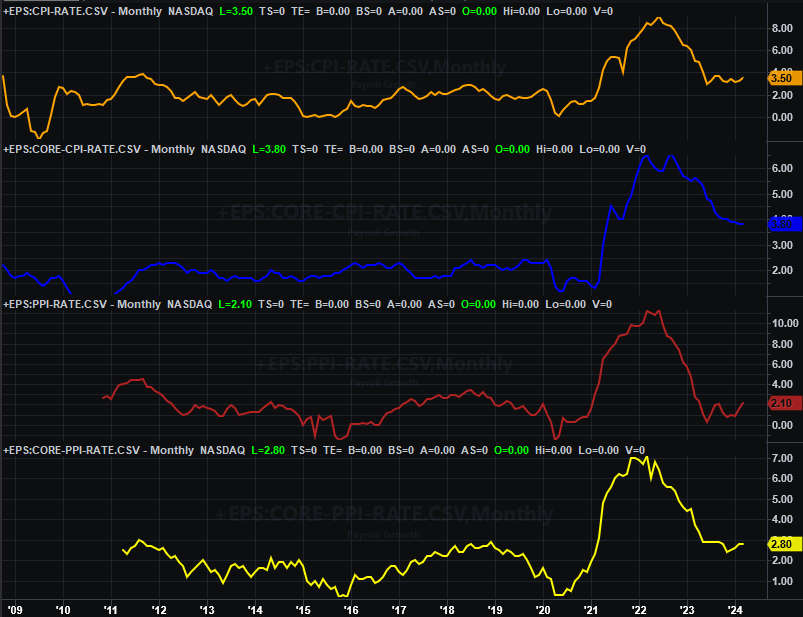
Source: Bureau of Labor Statistics, TradeStation
We’ll also be hearing April’s retail sales figures on Wednesday. Consumer spending has been mostly OK in recent months. But, forecasters suggest this already-tepid growth slowed even more last month.
Retail Sales Charts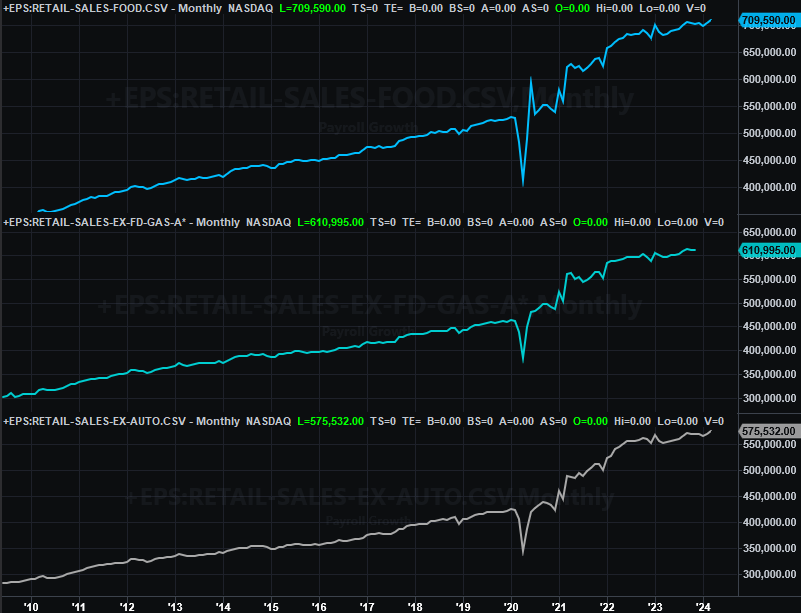
Source: Census Bureau, TradeStation
On Thursday look for April’s housing starts and building permits. Both tumbled quite a bit a month earlier. Economists believe we should see a slight rebound this time around, but not nearly enough of a rebound to believe demand for new houses is growing again. Blame the environment, and interest rates in particular.
Housing Starts and Building Permits Charts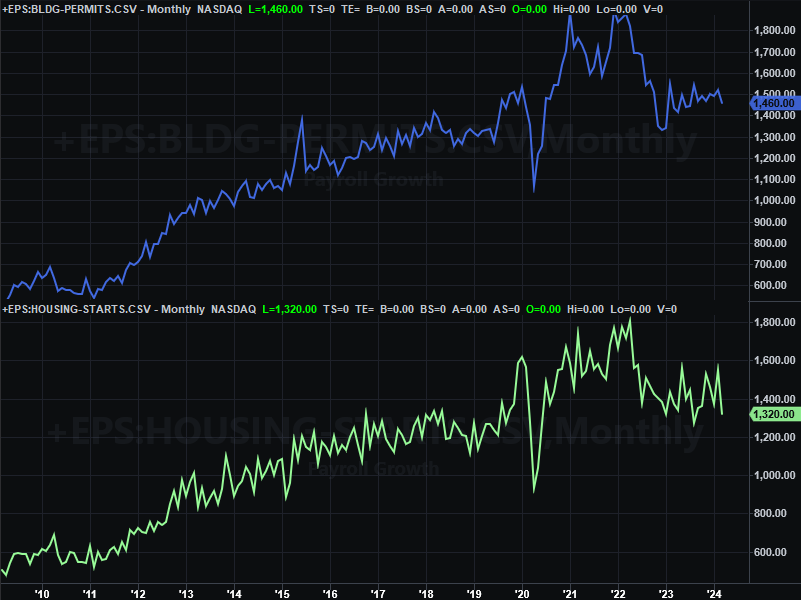
Source: Census Bureau, TradeStation
Finally, also on Thursday we’ll get April’s capacity utilization and industrial productivity figures. These economic barometers have been on the defensive for over a year now. While we’re not likely to see a major plunge, unsurprisingly, economists are calling for continued slowing.
Capacity Utilization and Industrial Productivity Index Charts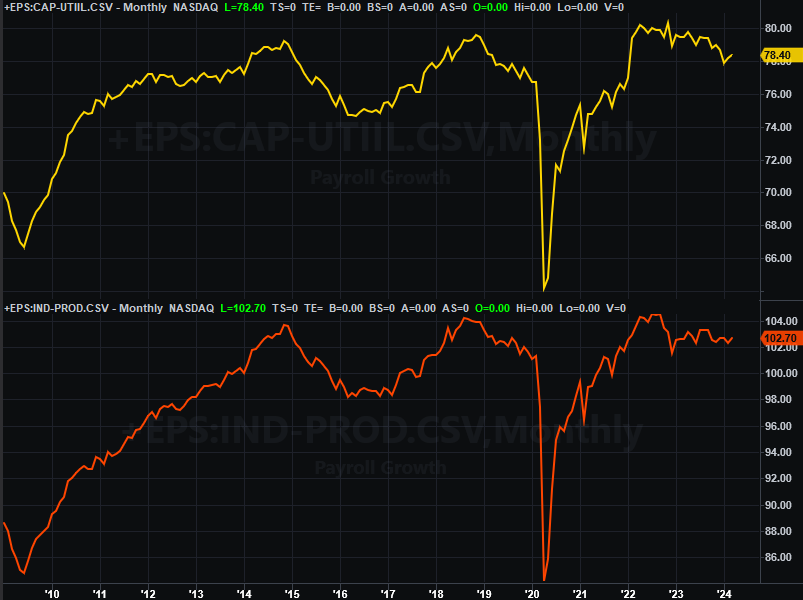
Source: Federal Reserve, TradeStation
Don’t dismiss this data, even if it doesn’t budge much this time around. The correlation between these two numbers from the Fed and corporate earnings is actually a pretty tight one.
Stock Market Index Analysis
Technically speaking, last week was a win for the market. The S&P 500 advanced nearly 1.9% last week, capping off a three-week win streak. The index now sits a little more than 5.2% above its mid-April low.
However, last week wasn’t exactly the kind of triumph that suggests you should expect more of the same.
The daily chart of the S&P 500 below readily shows us two worries. The first of these concerns is, although the index made gains over the course of last week, volume was waning all the way up; traders are dropping out of the rally as it progressed. And the second worry? The volatility index (or VIX) is back to a major technical floor (yellow, dashed) around 12.3. Although not impossible, this makes it tough tougher for the market itself to continue climbing higher.
S&P 500 Daily Chart, with VIX and Volume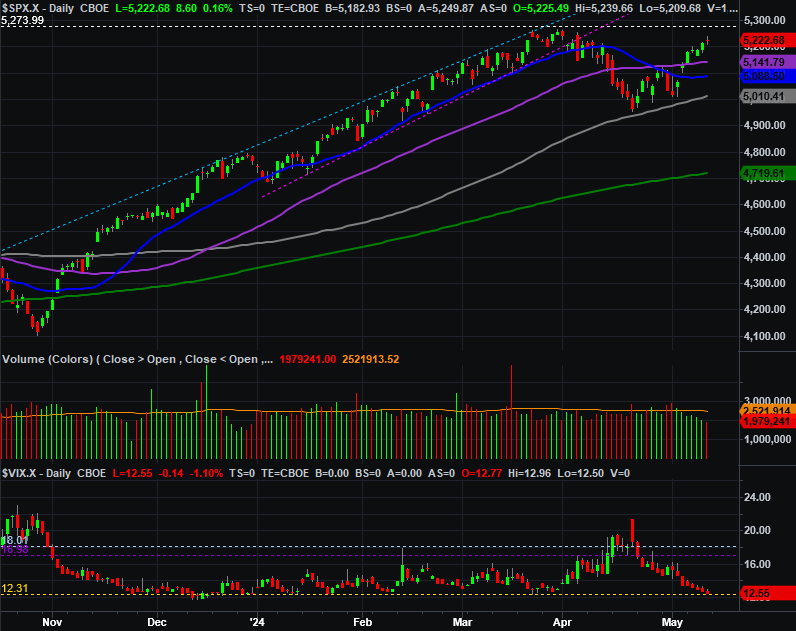
Source: TradeNavigator
And on something of a side note, the shape of Friday’s bar is a little bet troubling too. The open and close are both near the middle of the (relatively narrow) low-to-high range. Normally you’d like to see new buying all the way up right until the closing bell rings. That wasn’t the case on Friday though. The buyers were backing off just a bit, hesitant to carry their holdings into the weekend.
The daily chart of the NASDAQ looks pretty similar… a volatility index that’s back at a major technical support level (purple, dashed, at 16.2), and anemic volume. The composite is showing us something else, though, that can’t simply be ignored. That is, the rally started slowing down just shy of March’s and April’s high near 16,500 (white, dashed). Perhaps without even realizing it, traders have drawn a mental line in the sand there that will be difficult to cross.
NASDAQ Composite Daily Chart, with VXN and Volume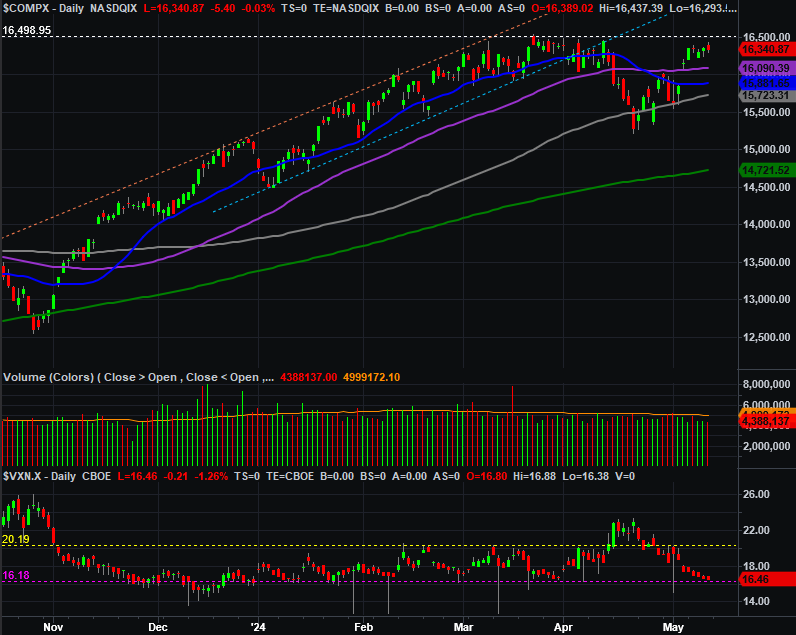
Source: TradeNavigator
Here’s the weekly chart of the NASDAQ Composite for a little more perspective. With just a passing glance April’s correction looks like a normal one, setting the stage for the next wave of bullishness. Take a closer look though. That pullback was neither big nor particularly long lived. From peak to trough the composite only fell about 8.5%, and most of that tumble materialized in a single week. Generally speaking we’d want to see something more like what we saw in September and October of last year to say a true correction was in, and the decks are cleared for the next bullish leg higher.
NASDAQ Composite Weekly Chart, with MACD and Volume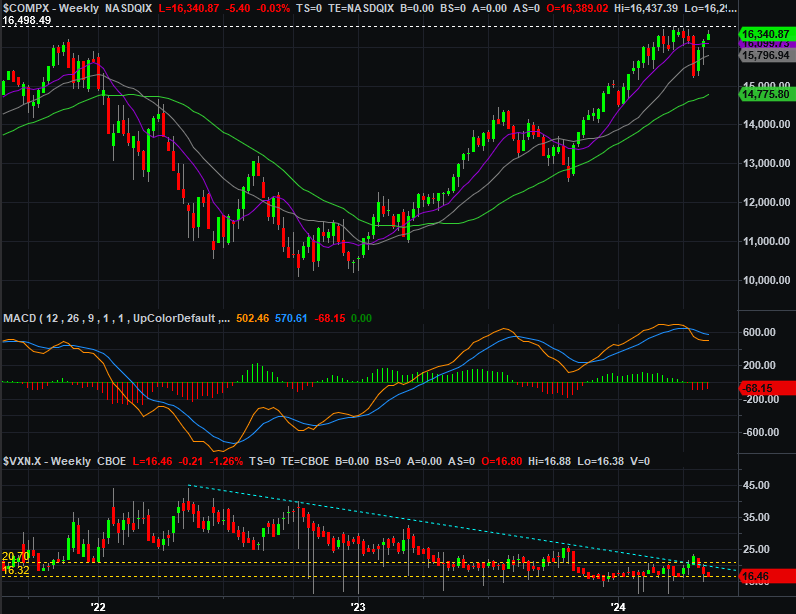
Source: TradeNavigator
Except, never say never.
It’s been a while since we’ve look at a breadth and depth chart, mostly because there’s been little reason to do so. There’s reason now, however, as doing so calls into question something mentioned above. That’s the lack of volume behind the recent gains. While volume is minimal, what volume we’re seeing is still decidedly bullish. In the same vein, breadth (advancers versus decliners) is also leaning in a bullish direction.
NASDAQ Composite Up vs. Down Volume, Advancers vs. Decliners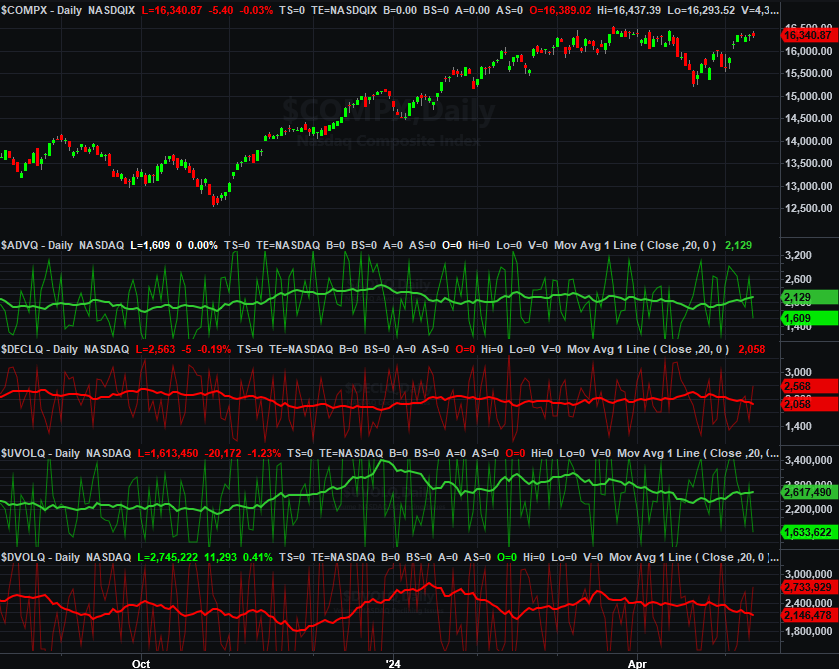
Source: TradeNavigator
While we’re not showing it here, the S&P 500’s as well as the NYSE’s breadth and depth comparisons look about the same.
The point is, from a technical and momentum perspective, despite last week’s red flags, the trend here remains bullish. Underscoring this reality is the fact that we’re in a time of year that’s usually modestly bullish anyway. From here it’s just a matter of who flinches first… the bulls, or the bears.