Weekly Market Outlook - A Good Rally Effort Spoiled
 It was almost a great week for the market. But, a little scare on Friday got a lot of traction, turning a winning week into a loser.
Still, this schizophrenic market could just as easily reverse course again, as it has several times of late. The S&P 500 is still holding above all of its key moving average lines, and found perfect support at the 20-day moving average line on Friday. Stocks haven't made their way anywhere near the point of no return.
There are a couple of big red flags, however.
We'll explore those red flags and other key clues below, as always. First, however, let's run down last week's economic news and preview this week's economic news. Investors have been paying particularly close attention to these reports, trying desperately to figure out just how strong - or weak - the economy is.
Economic Data Analysis
Last week's biggie was the FOMC's decision about interest rates. Barring any unexpected changes in the near future, this year's planned interest rate hikes have been all but canceled, with only one expected in 2020. The dialed-back hawkishness suggests the Federal Reserve sees fresh economic headwinds.
That wasn't the only noteworthy data from last week, however. It was also a big week for the housing market, with existing home sales figures for February being posted. They were up, quite a bit, from January's pace of 4.93 million to 5.51 million.
New, Existing Home Sales Charts

Source: Thomson Reuters
We won't know until this week if that surge is going to be mirrored by new-home sales. For the record though, there's very limited existing-home inventory, while there's quite a bit of new-home inventory. The odd surge of existing home sales, in fact, may well be a fluke. We'll see.
Oil inventories also fell, by 9.6 million barrels. Natural gas inventories slumped as well. That's an important shift for crude, which up until January had been toying with an increase that could readily up-end fragile oil prices. It appears U.S. producers are a little more disciplined and are practicing a little more restraint than some have feared.
Natural Gas, Crude Oil Inventory Charts

Source: Thomson Reuters
Everything else is on the grid.
Economic Calendar

Source: Briefing.com
This week is going to be much busier. The party gets started on Tuesday with a double-dose of housing market information. We'll hear the S&P Case-Shiller Index as well as the FHFA Housing Price Index. Both are expected to improve again, extending a long-standing but slowing uptrend.
Home Price Index Charts

Source: Thomson Reuters
Although the pace of home-price growth is slowing, the bullish trajectory is still something to celebrate.
That's not the only real estate data we'll be getting on Tuesday, however. On that same day, we'll get February's housing starts and building permits reports. The pros are calling for a slight slowdown from January's levels. That's a concern, as both data sets have been flattening out for several months.
Housing Starts, Building Permits Charts

Source: Thomson Reuters
Also on Tuesday we'll get a look at March's official consumer confidence reading from the Conference Board, followed by Friday's last update of March's consumer sentiment score from the University of Michigan. The pros are looking for another month of forward progress.
Consumer Sentiment Charts

Source: Thomson Reuters
As long as consumers are feeling optimistic, the economy will remain firm enough... despite the 'professional' rhetoric that casts a shadow of fear on the market.
Finally, on Thursday, look for the third and final report of Q4's GDP growth reading. Economists are calling for a downward revision, from 2.6% to 2.5%. That's still a solid reading though, even if slower than most of last year's prints.
GDP Growth Charts

Source: Thomson Reuters
Stock Market Index Analysis
It was a nice little headfake from the bears on Thursday. Stocks rekindled a break above a major technical resistance line, but only to make Friday's tumble all the more painful.
And yet, as rough as Friday's 1.9% setback was, it's still not pulled the market below even the first of its key technical floors. The S&P 500 remains above its 20-day moving average line, as well as above all of its other key moving average lines.
Nevertheless, there are still some key concerns here that suggest the market is going to have to fight to hold its ground. Chief among them is the amount of volume that materialized with Friday's setback. It wasn't huge, but it was above average, and above Thursday's bullish volume. There were more sellers than buyers last week.
S&P 500 Daily Chart, with Volume

Source: TradeStation
The other big red flag? The VIX. It popped in a pretty big way on Friday. It didn't make its way above a key technical ceiling around 18. But, it's testing that line in the sand at the same time the S&P 500 is testing support at its 20-day moving average line. If both push through, that could signal at least a little profit-taking pressure.
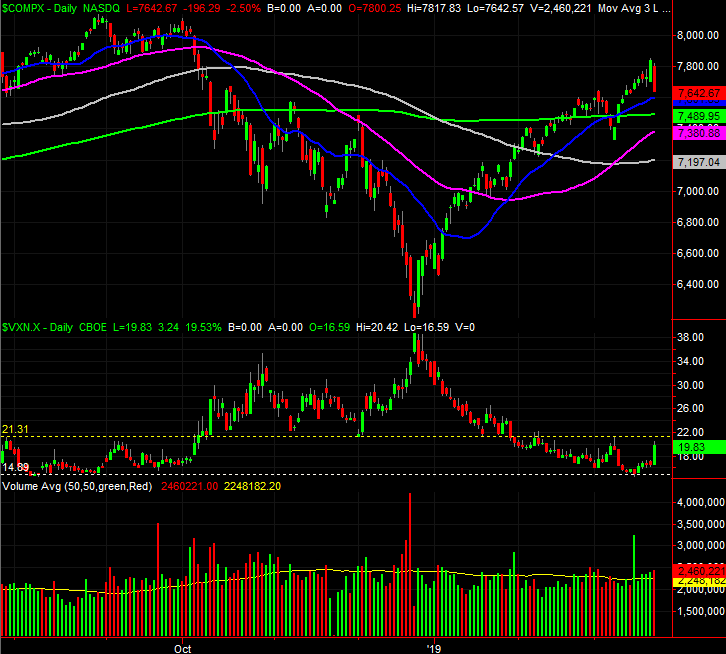
The daily chart of the NASDAQ Composite more or less tells the same story. The only exception is, of course, the VXN. Its line in the sand is the ceiling around 22. If it fails to keep the VXN in check, that will likely coincide with a more serious - though not devastating - pullback from the NASDAQ.
NASDAQ Composite Daily Chart, with Volume
Source: TradeStation
Zooming out to the weekly chart of the S&P 500 puts things in perspective. It's in this timeframe we can get a really good feel for just how rapid the rebound from the late-December low has been. It's also on the weekly chart of the S&P 500 we can see last week's bar was a reversal-oriented one, marked by a low open, a lower close, and a conspicuously high peak. This shape suggests a transition from a net-buying to a net-selling environment. The weekly chart also makes clear just how low the VIX is from a key bottom-making peak.
S&P 500 Weekly Chart, with Volume

Source: TradeStation
Or, maybe not. As was noted already, this market environment has been one plagued with indecision thanks to political, trade and regulatory volatility that has left investors guessing as to what the future holds.
The smart-money move here is to wait. Namely, we're going to wait and see how traders respond to Friday's shocking stumble. Maybe it was a one-off. Or, maybe it's a sign of the shape of things to come. It was, after all, the worst day we've seen in weeks, and took shape following one of the best and fastest rallies we've seen in years.
We know exactly what to look for though. The VIX is toying with a well-established ceiling, while the S&P 500 is touching a well-established floor. The volume is slowly but surely starting to lean in a bearish direction action. The bulls will get one, maybe two, chances to quell the brewing stumble. If that doesn't happen, odds are good we'll see at least a modest pullback. Even then though, there are several key moving average lines in view, each of which could stop the bleeding.
The VIX and VXN will tell is much more about the market than the market indices will for the foreseeable future.