Wednesday's Gain Was More Than Just a Gain. It Was a Game-Changer.
That's it. That was the big one. While Wednesday's 1.05% advance from the S&P 500 was relatively tame, the move got the market over the last of the key hurdles it needed to clear. While the effort thus far doesn't officially mark the beginning of a new bull market, it does certainly suggest stocks have shaken off the bear market blues.
Take a look at the daily chart of the S&P 500 to see what we mean. The index was already well above all of its key moving averages. It just put some more distance between itself and them today. Rather, the big victories on this chart on Wednesday was the break above the recent horizontal ceiling at 4096 (blue), and today's so-called "golden cross"... a cross of the 50-day moving average line (purple) above the 200-day moving average line (green). This even portends new bigger-picture bullishness.

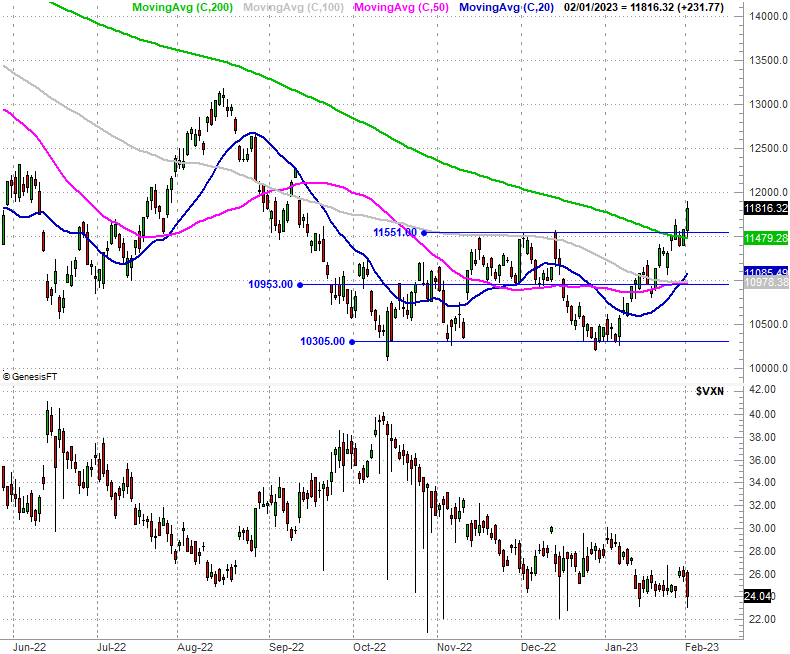
The NASDAQ Composite chart fared even better, putting even more distance between itself and the technical resistance it cleared last week. Or, perhaps it would be more correct to say re-cleared this week. Either way, the technical ceiling in question is/was 11,552 (blue), where the index stalled a couple of times in December, and where it's been dancing since the late part of last month. That line in the sand is a bit further in the rearview mirror now.
For what it's worth, the Dow Jones Industrial Average didn't move above one of its biggest technical hurdles this week, although it did test the last of these ceilings with Wednesday's high. That's the 34,288 level (blue) the Dow peaked at in mid-January... and near where it topped out in December.
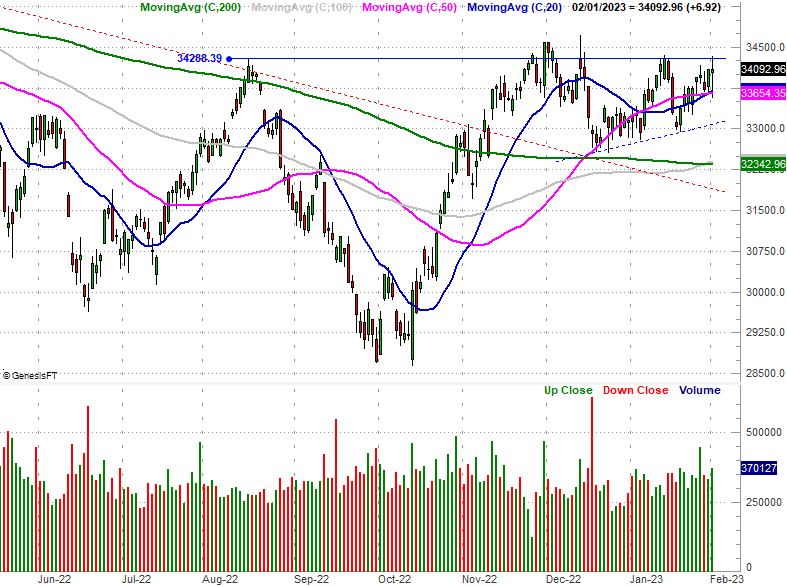
Still, you have to like the way the Dow Jones Industrial Average is now finding support at its 20-day (blue) and 50-day (purple) moving average lines.
This isn't to suggest stocks are destined to continue moving higher without interruption or impediment. They might do that, but it's unlikely. It's simply to point out that most of the major indices are making important technical progress they've not been able to make in quite some time. Notice there's room for a bit of a pullback with the NASDAQ Composite as well as with the S&P 500 that wouldn't actually break the new uptrends. That's the other half of this test.
That being said, it's not too early to talk about potential upside targets, should this budding breakout effort be the real deal. Right now the most plausible one is the 4309 level for the S&P 500. That's not only a 61.8% Fibonacci retracement of the entire bear market, but is also where the index made a major high back in August. When key levels like this align, they tend to mean so much more.
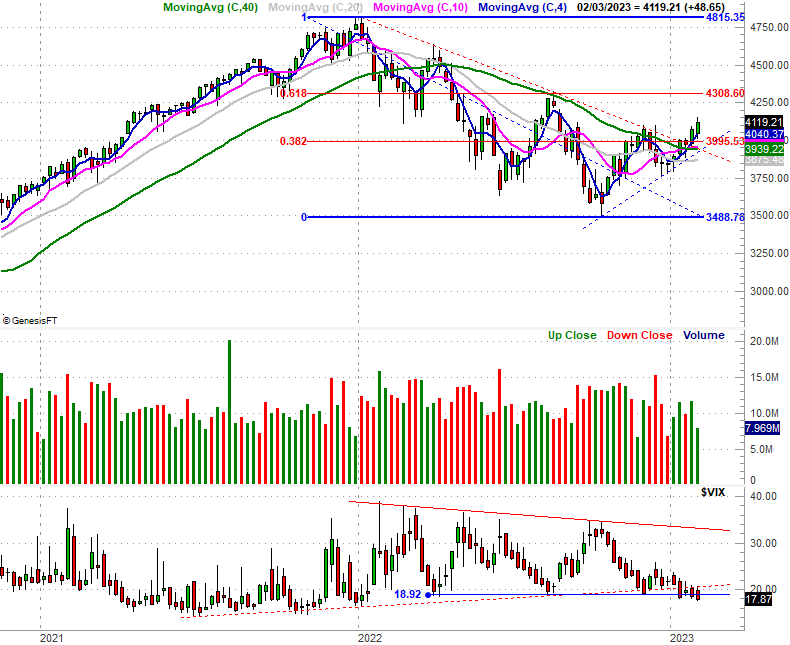
Also notice on the weekly chart that the S&P 500's Volatility Index (VIX) has finally broken below horizontal support at just under 19. It's been trying to do so for the past four weeks, but the effort was unconvincing until today, when the S&P 500 finally played along with its bullish thrust.