Wednesday's Dive Is Officially a Worry. Here's Why.
In the grand scheme of things, Wednesday's 1.0% setback isn't the end of the world; the market's certainly survived (and even shrugged off) worse. Given the context and underlying details of the modest pullback though, it's something to note.
But, first things first.
As a trader, you should be wary of making the same cause-effect assumptions the media likes to preach. The Federal Reserve's new tapering bent got the blame for Wednesday's weakness, but truth be told, traders have been unconsciously looking for a reason to bail out for some time now. That particular headline just happened to be an opportune one.
Nevertheless, the fact that traders latched onto the news is telling in light of what panned out as a result.
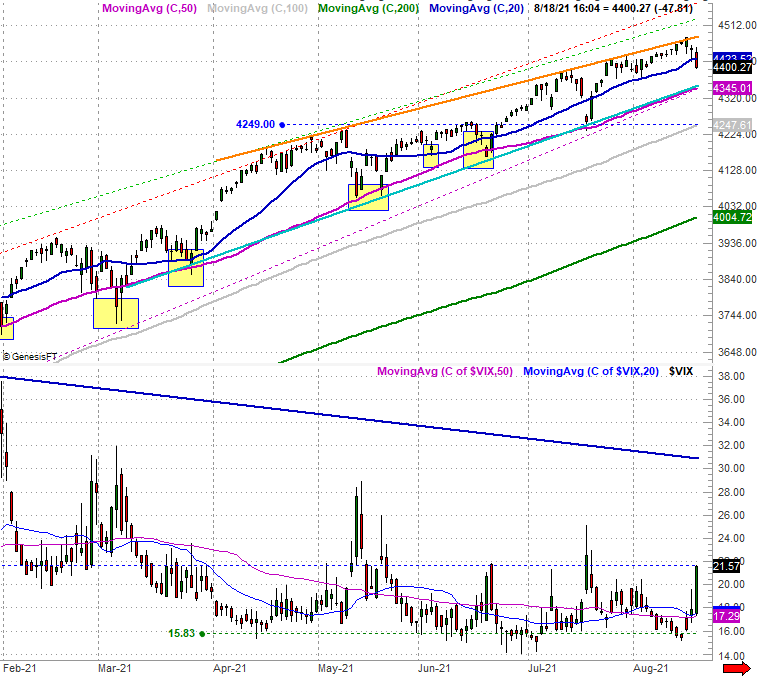
For starters, with the tumble the S&P 500 is now below the 20-day moving average line (blue) at 4423 that as recently as yesterday hinted was going to hold up as a technical floor. It's not a fatal blow. The key support level right now is at 4345 -- and rising - where the 50-day moving average line (purple) has intercepted a straight-line floor (light blue) that connects all the key lows since late-March. That floor also lines up with a rising technical support line that goes all the way back to last November (purple, dashed). Take a look.
What we really want to zero in on, however, is the CBOE Volatility Index (VIX) at the bottom of the graph. It bolted higher, moving right up to a ceiling of its own around 21.5 (blue, dashed).
Yes, we've seen the VIX do this before... only to peel back pretty quickly. That may well be what's in the cards this time around too. If you look closely though, the VIX has slowly but surely been working on a reversal out of a downtrend and into an uptrend. This is a bit more evident on the weekly chart below, as is the ever-narrowing trading range the S&P 500 itself is stuck in.
The narrowness of this range (the upper boundary is orange while the lower boundary is a teal color) is a tripwire in and of itself. It doesn't leave the S&P 500 much room to maneuver. It's a problem simply because a break below the lower floor wouldn't be difficult to cause, yet such a break could easily be interpreted as the beginning of a breakdown. This of course would have the effect of starting the very selloff traders fear is about to unfurl. This also, of course, would coincide with the VIX continuing its uptrend above its ceiling around 21.5, and eventually above its falling ceiling (solid blue) currently at 29.6.
There's no reason to panic -- or act -- just yet. Wednesday's stumble may have just been a one-off that doesn't go anywhere. Like we said though, seeing this sort of action in these particular circumstances at this time of year with such a huge jump from the VIX broadly suggests traders are starting to rethink... well, a lot of things. That's often what you see at major turning points like the one the FOMC says it's thinking about supporting.