Tuesday's Intraday Action Could Prove Surprisingly Problematic
Technically it was a win. The S&P 500 closed 29 points higher on Tuesday... a 0.7% advance. The index even pushed its way above some key technical resistance in the process. By the time the closing bell rang though, most of its intraday gain had been given back. It also closed back below a couple of its key technical ceilings.
And that's a bit of a warning.
How so? It's kind of a complicated, philosophical concern. It's one worth voicing all the same though, since it may well have implications from here. Simply put, the bulls took their best shot at a break out of a long-lived funk. They didn't follow through very well. Said another way, when the bulls had their chance to send a clear and decisive message, they didn't.
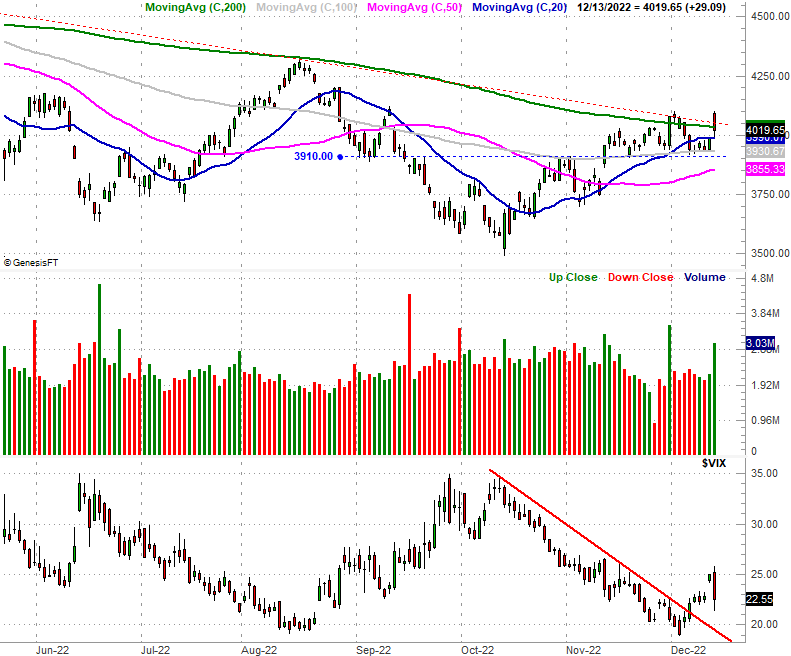
Take a look at the daily chart of the S&P 500 below to see what we mean. While capped below the 20-day moving average line (blue) through Monday, on Tuesday, the index spent the entirety of the session above that line. It even poked above its 200-day moving average line (green) and the straight-line resistance (red, dashed) that had been holding it down since January. It didn't remain above either of those levels though, peeling back from what was at one point a 2.7% gain. Most of the day was spent falling rather than rising.
The NASDAQ did something similar. That it, it opened above a key ceiling around 11,487, and above its 100-day moving average line (gray). It didn't finish above either, however. Like the S&P 500, the composite was sliding back from a strong open for the bulk of the day.
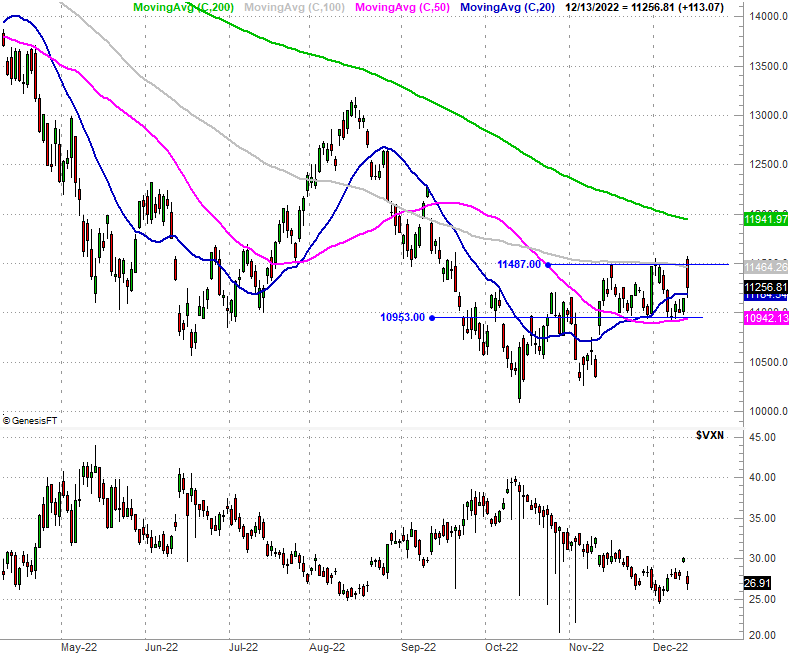
There is one bright spot. On both of the charts above it appears the indices are now finding support at their 20-day moving average lines that had been technical resistance through Monday.
This isn't a call for a new pullback... at least not yet. Tuesday's action, however, is anything but the ideal beginning of a breakout. Sustainable breakout efforts tend to start modestly and accelerate up and into -- and then through -- technical resistance. This one is mostly pointed in other direction, with traders jumping the gun on what seemed and felt like encouraging inflation news. They weren't nearly as encouraged after having a few hours to think about it.
Or, maybe enough traders have been waiting on the sidelines for some strength to sell into. They finally saw enough on Tuesday to pull that trigger.
In any case, Tuesday's action makes Wednesday's trading a big day... far bigger than it might normally be. It will continue to put pressure on the bulls to make then move forward in a much more aggressive way, or force them to bow out when the going starts getting tough. Tuesday's session's shape means they flinched.
Tuesday's session did do us one favor, however. The S&P 500's high? It was in line with the high of 4080 hit at the very beginning of this month. There's something about that level. If the S&P 500 can fight its way past that mark, that's not just a win. It's a huge win. By that point the index will also be above the aforementioned straight-line resistance as well as its 200-day moving average line it was unable to remain above today.
In a similar vein, the NASDAQ Composite defined a key technical ceiling around 11,550. A move above that level from here would (again) be a very big, bullish deal. Also again though, traders didn't end Tuesday's action showing any real interest in testing that ceiling again.