
Stocks were routed pretty well on Monday, with the S&P 500 suffering a 1.8% setback. The other indices took comparable tumbles too.
On balance though, it's not the end of the world nor is it the beginning of a full-blown correction. The rally effort that's been underway since mid-October is still intact. It's just taking a break. And, it's doing so at a place where a pause could have been expected.
Translation: Don't jump to a bearish conclusion just because stocks sold off to get the new trading week started.
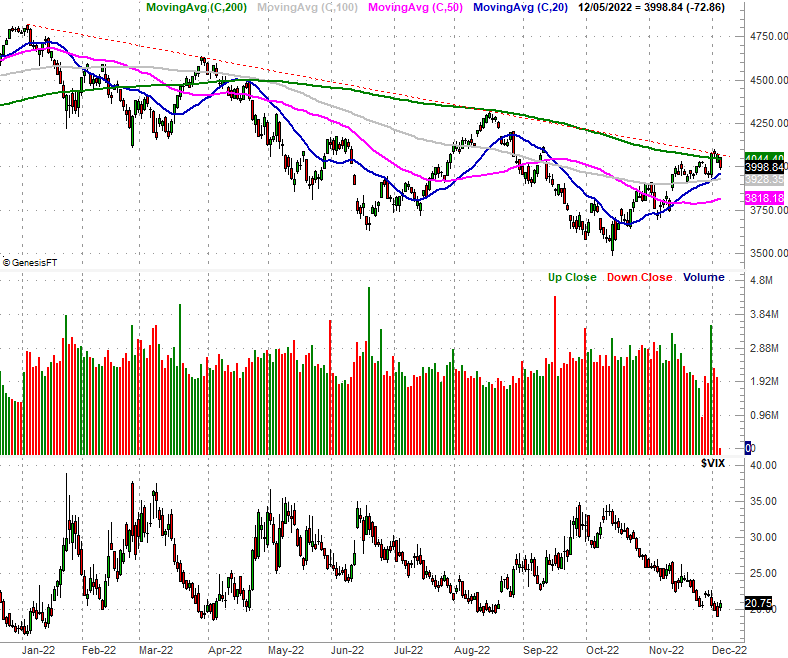
Take a look at the daily chart of the S&P 500 below. As was explained in this past weekend's Weekly Market Outlook, the index was clearly stalling as it tested the technical ceiling capping all of its rally efforts going back to January's high. Today it peeled back from that resistance, pulling back under its 200-day moving average line (green) in the process. Even with the selloff, however, the S&P 500 remains above all of its other key moving average lines. Chief among them is the 20-day moving average line (blue) at 3957.
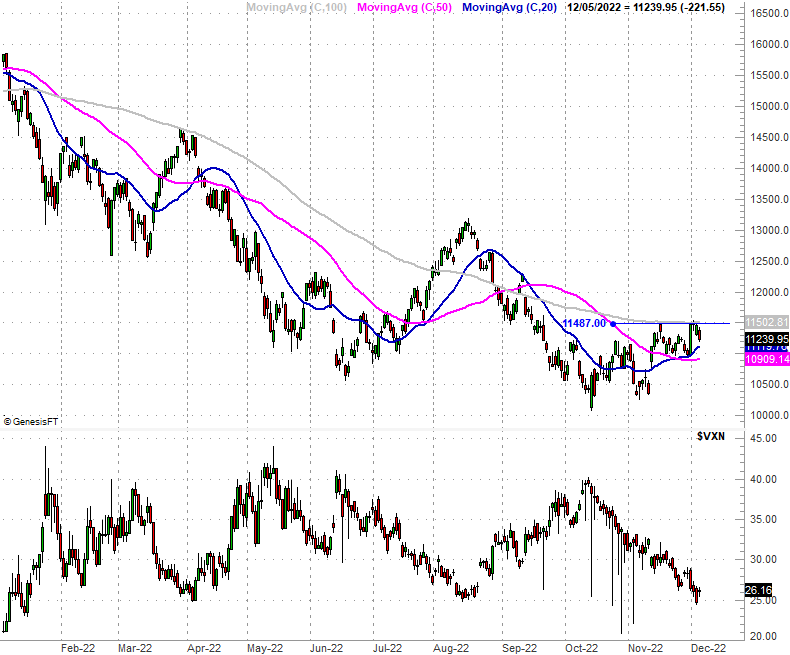
The same goes for the NASDAQ Composite. It pulled back today after bumping into a major technical ceiling at 11,490 late last week. But, even with today's 1.9% tumble it's still above all of its key moving average lines including its 20-day line (blue) at 11,120.
None of this is to suggest the bears won't keep on rolling from here and sooner than later drive these indices below all their most important moving average lines. That's not happened yet, however, and may not happen at all. We can only wait and see.
We'll just add that Monday's slight lull may actually be the best thing for the bullish effort. Rather than carrying the indices through an uninterrupted bullish run that invites enough profit-taking to turn into full-blown bearish momentum, this lull allows the bulls and buyer to regroup and reset so they can safely stage the next, more sustainable leg of the bull market.
And, there's one detail on both charts above that seemingly makes this even more possible than you might believe. That's the volatility indices... the VXN for the NASDAQ Composite, and the VIX for the S&P 500. Despite the sizeable setback for stocks on Monday, neither the VIX nor the VXN even hinted their downtrends were ready to reverse into uptrends. The volatility indices will (or at least should) be willing and able to move upward if the market indices are actually going to dish out a sizeable selloff.
Be cool here, which is to say, don't be in a hurry to take on a trade in either direction. The market's very much stuck in the middle here, above important support levels yet below important resistance lines. It could waffle for a while longer while it's getting its bearings before moving out of this narrowing trading range. That may well be worth waiting on before digging in here.