Friday Is a Make-or-Break Day for the Stock Market
Ouch. Thursday's selloffs wasn't just annoying, or even just painful. It was damaging. Most of the major indices fell under key technical floors that needed to hold
up for the market's budding bullishness to have any hope at turning into something bigger.
There may be a few slim chances that stocks step back from the brink on Friday. But, the bulls are going to have to do something firmly and decisively to salvage the
bullish reversal going back to October. Barring that, we could easily make another major leg lower. And all this is happening with February's jobs report slated for
release on Friday morning prior to the market's open.
Take a look at the daily chart of the NASDAQ Composite to see what we mean. The composite broke back under its 200-day moving average line (green) before finding
support at its 50-day moving average line (pink). But, any lower low will snap the floor being made by the 50-day line, leaving only the 100-day moving average line
(gray) as a last-ditch technical floor.
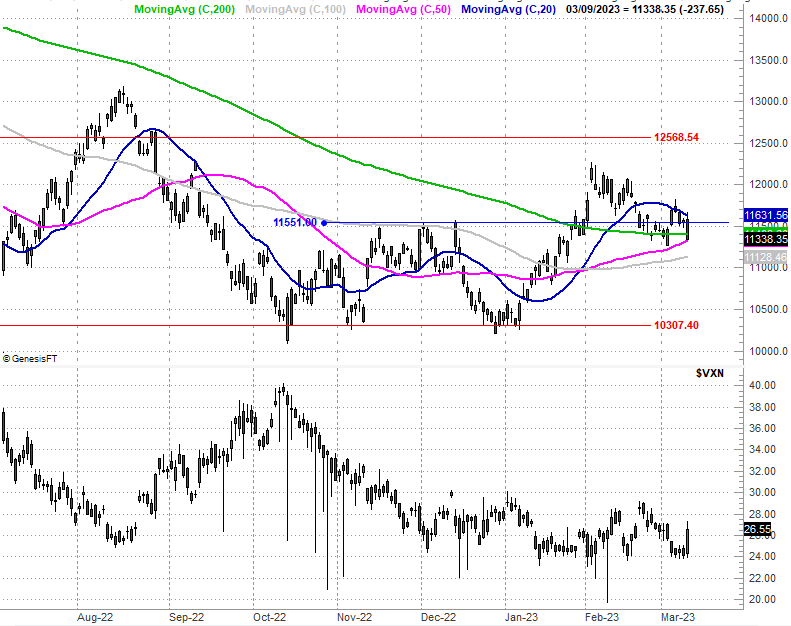
Also notice the NASDAQ's 20-day moving average line (blue) seems to be serving as a ceiling now, pushing any rally efforts back to even lower lows.
The S&P 500 is in a similar -- though not identical -- situation. And, its situation is worse than the NASDAQ's. The S&P 500 broke under its now-converged 200-day
(green) and 100-day (gray) moving average lines at 3947, pulling the index below all of its moving averages.
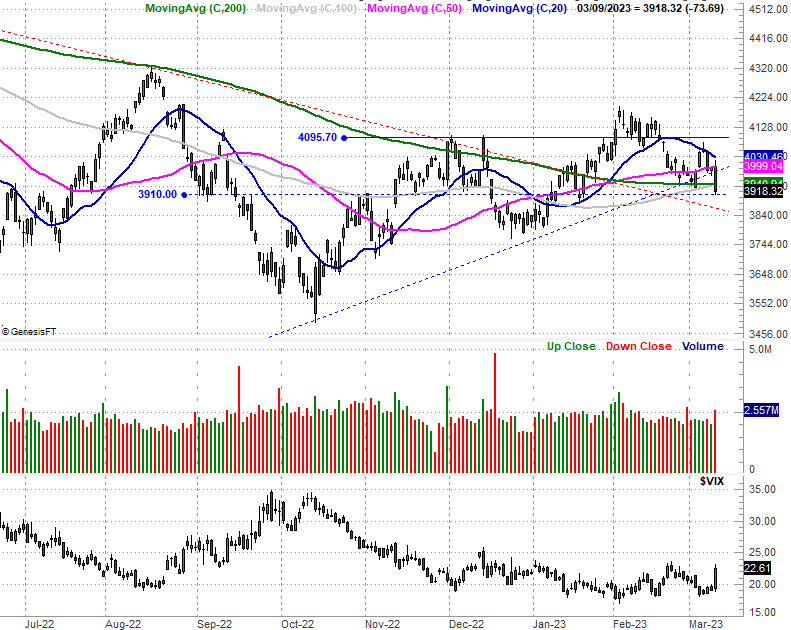
There's a little bit of hope the index will find a floor at 3910, near where it found support as well as resistance a few times since October's bottom. But, that's a
fleeting hope in light of the fact that the S&P 500 also seems to be bumping into technical resistance at its 50-day (pink) and 20-day (blue) moving averages. Also
note how there was quite a bit of volume behind today's selling... more than the recent average anyway. That's hint that a lot of people are ready to head for the
exit (if they haven't already).
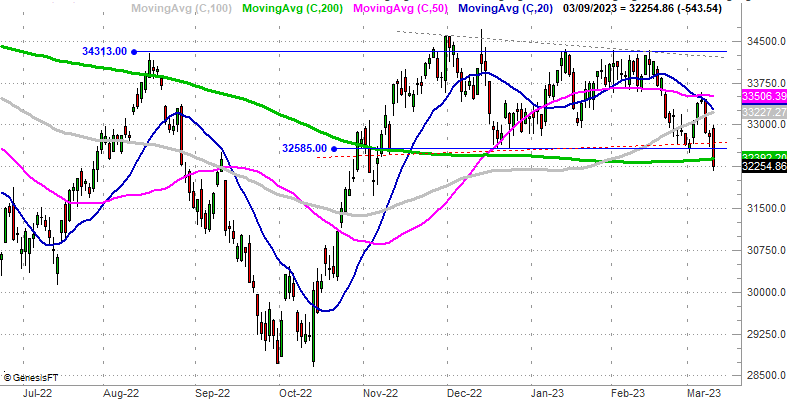
And the Dow Jones Industrial Average isn't holding up any better. In fact, as of Thursday it's in the worst shape of all. The blue chip index fell so sharply on
Thursday that it plunged below a horizontal floor at 32,585 (blue, dashed) as well as the 200-day moving average line (green) at 32,397. And, much like the NASDAQ
Composite and the S&P 500, the Dow Jones Industrial Average broke down after testing but not breaking above its shorter-term moving average lines late last week and
early this week.
Never say never. There's a chance that traders could undergo a sweeping change of heart on Friday, perhaps fueled by an unexpectedly encouraging jobs report. And in
this case, a weak report could be encouraging, in that it would take some pressure of the Federal Reserve's plan to continue cranking up interest rates. On the other
hand, no matter what Friday morning's jobs report looks like, the Fed may have little choice regardless of what last month's employment situation looks like.
The only thing to do about it at this point is simply knowing where the market's going to start Friday's action, and where the remaining lines in the sand are... and
there aren't many of them left intact.