Q4 Seasonality and 1995 vs 2013 Government Shutdown
Q4 Seasonality and 1995 vs 2013 Government Shutdown
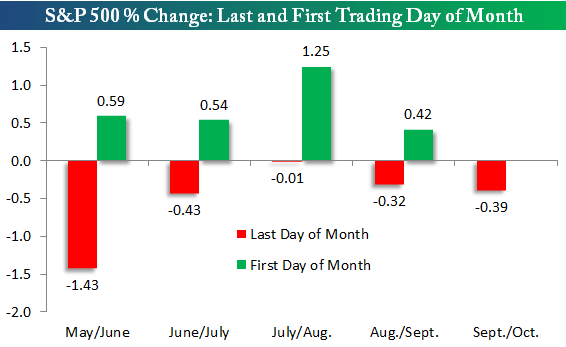
Last-Day Selloffs, First-Day Rallies
The S&P 500 (SPX) (SPY) looks to be continuing a trend today by selling off on this last day of the month. The bulls are hoping the trend continues Tues with a day of gains. Since May, the S&P 500 has declined on the last trading day of the month and then rallied on the first trading day of the following month. The last day of the month declines and first day of the month gains are highlighted in the chart below.
1995 Government Shutdown
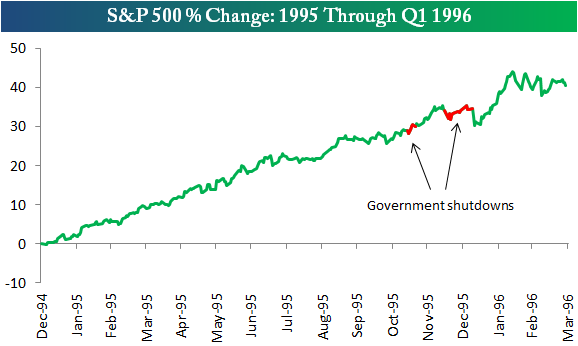
With a potential government shutdown looming large, below is a look at how the S&P 500 reacted the last time the government shut down. Back in November and December of 1995, President Bill Clinton and Speaker Newt Gingrich faced off and shut down the government twice. The first occurred from November 14th, 1995 through November 19th, 1995, while the second occurred from December 16th, 1995 through January 6th, 1996.
As shown below, the market basically shrugged off the entire event. The S&P 500 actually moved higher during both shutdowns, and its only declines came briefly in the aftermath of the second shut down.
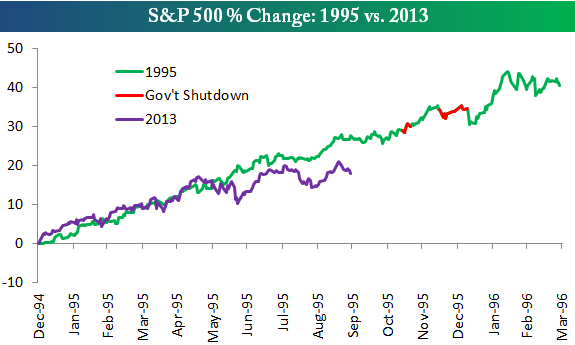
Ironically, the market's action in 2013 has been compared to the market's action in 1995 quite a bit this year, even without the government shutdown parallel. As shown in the chart below comparing the S&P's action in both years, the first five months of this year tracked 1995 very closely. Since June, the S&P hasn't been able to keep up the pace of gains that it saw in 1995, so the correlation isn't as high as it was, but the patterns remain similar.
Q4 Seasonality: The Most Wonderful Time of the Year
With Q3 coming to a close, 2013 has been nothing but great for the bulls, but as we head into Q4, what does history tell us to expect for the remainder of the year? We looked at the performance of sectors during the fourth quarter, and the table below lists the results going back to 1980. Below that we have also included a chart showing how often each sector has been up in Q4. As shown in the chart, Q4 has historically been strong for equities as the S&P 500 (4.26%) and all ten sectors have averaged positive returns.
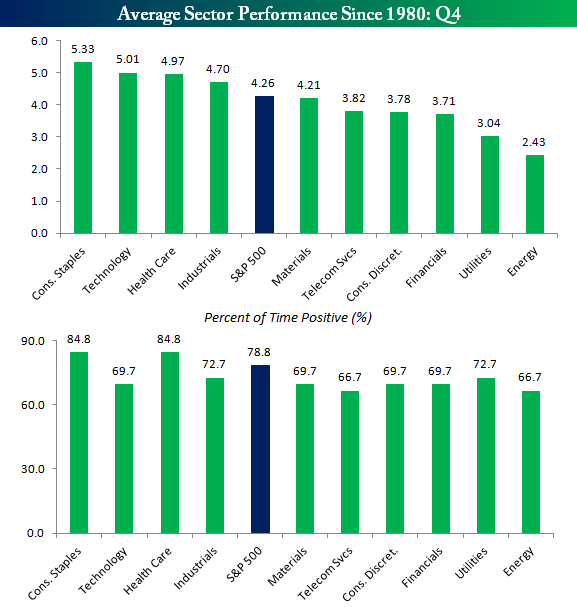
Consumer Staples (XLP) has seen the best returns during the quarter, averaging a gain of 5.33%. Technology (5.01%) (XLK) is the only other sector that has averaged a gain of more than 5% during the quarter, although Health Care (XLV) is not far behind at 4.97%. On the downside, even sectors like Energy (2.43%) (XLE) and Utilities (3.04%) (XLU) that have lagged the market have seen decent returns in Q4.
In terms of consistency, Consumer Staples and Health Care have been the most consistent on the positive side with gains 84.8% of the time. Since 1980, the only years where the Consumer Staples sector has declined in Q4 were 1980, 1987, 2005, 2008, and 2012. For Health Care, 1983, 1987, 2007, 2008, and 2012 are the only years where the sector declined in Q4 going back to 1980.
Obviously, anything can happen this year, but from a seasonal perspective, history is on the side of the bulls.
Courtesy of Bespoke Investment Group