13 Year US Chart Pattern, Copper, China & Bonds
These Leading Indicators Are Suggesting a Global Slowdown Is at Hand
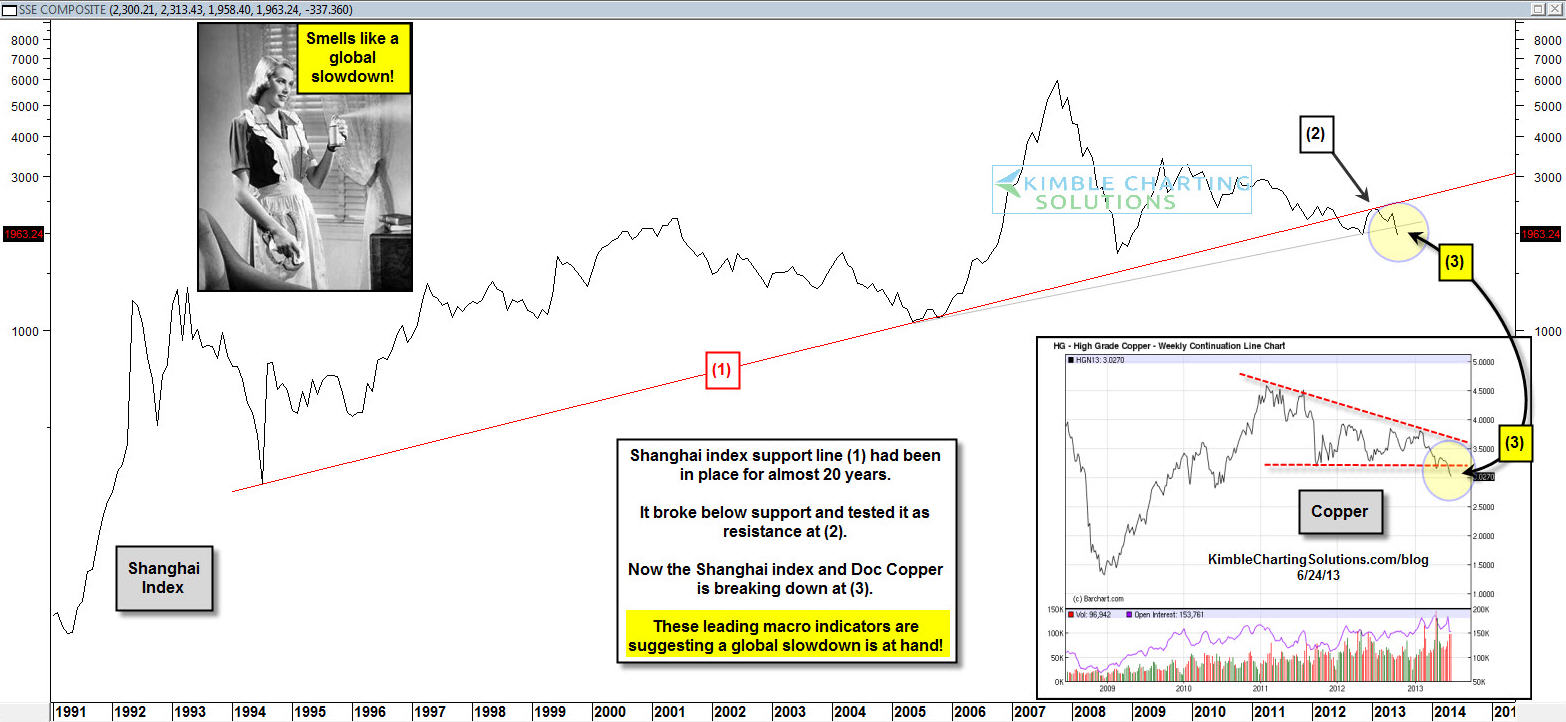
The Shanghai Index (FXI) broke below 20-year support line (1) in the chart below, attempted to climb back above this new resistance line and looks to have failed at (2). Now the Shanghai index is breaking down further and Copper (JJC) is breaking a three year support line at the same time (3).
These leading indicators breaking support at the same time are suggesting a global slowdown is near.
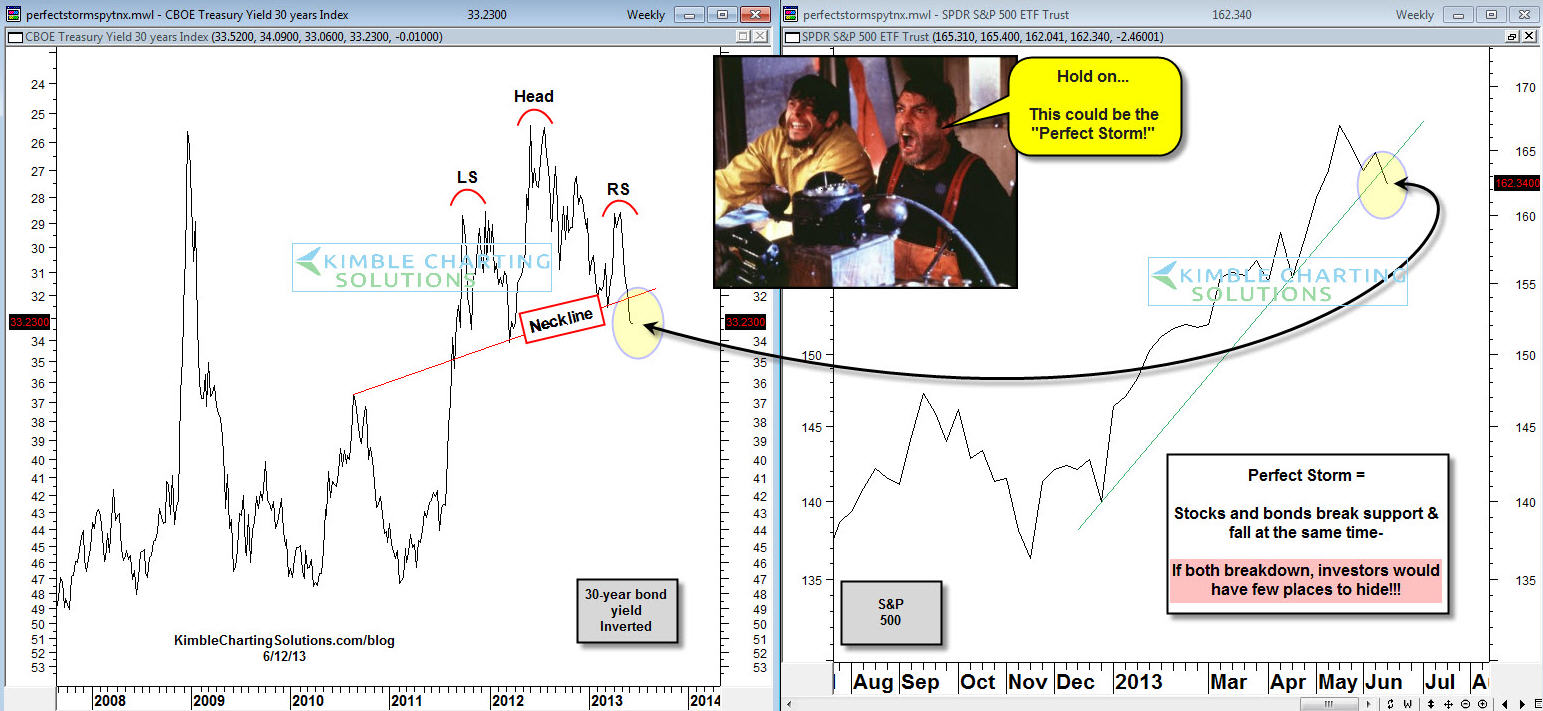
Do these breakdowns reflect the "Perfect Portfolio Storm" is about to happen or is happening?
The above chart reflects that Government Bonds (TLT) and stocks (SPX) (SPY) are working on breakdowns at the same time, a further suggestion something is going on that investors haven't seen many times in the past 13 years!
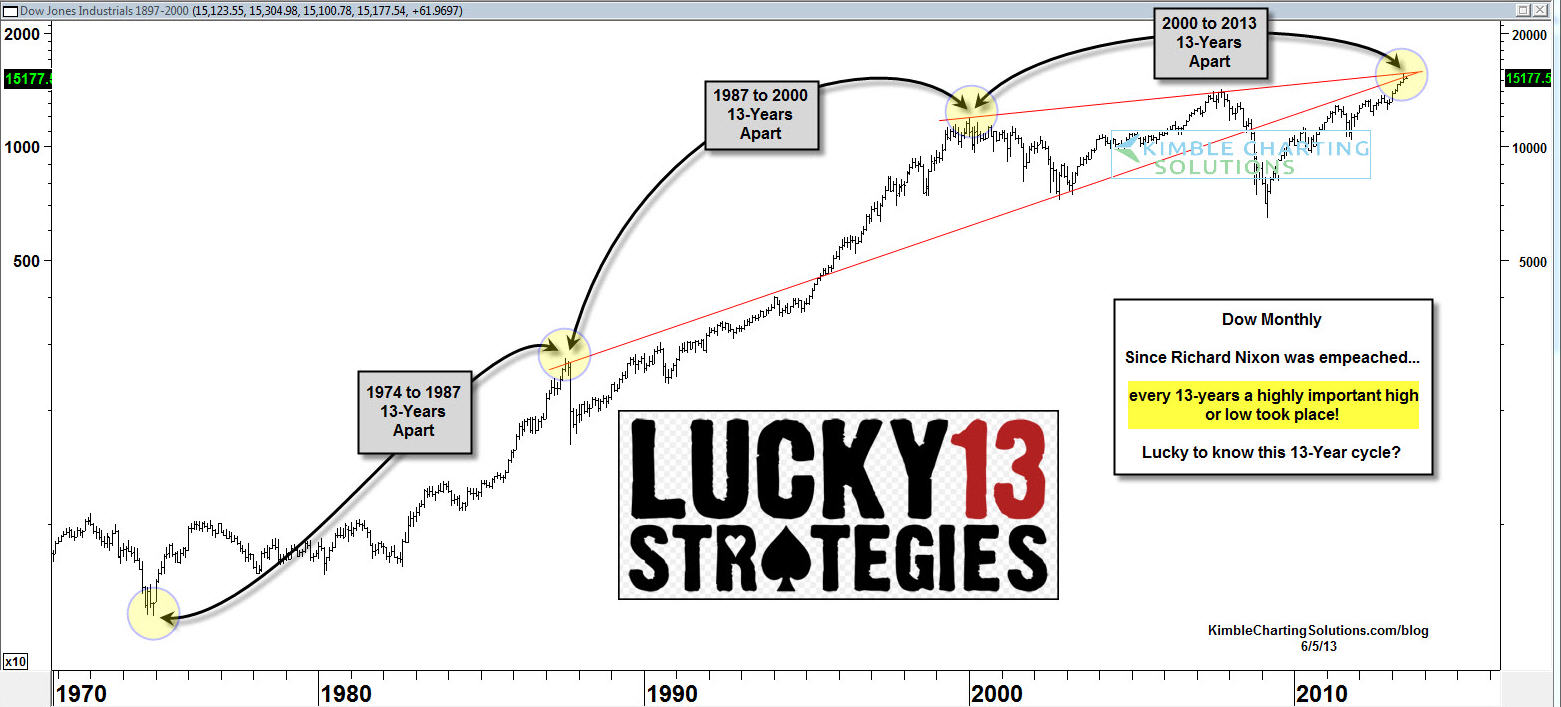
Speaking of 13-years, since the mid 1970's every 13 years a historic high or low has taken place in the Dow (INDU) (DIA), reflected in the chart above. Will we have another repeat this year?
Courtesy of Chris Kimble & Doug Short, http://www.philstockworld.com


