
As far as rebound efforts go, Tuesday's bullishness wasn't exactly what the optimists wanted to see. The gain didn't undo all of Monday's damage, and the advance the market was able to muster was a low-volume effort. Generally speaking, for a move to have any follow-through, it needs more – not less – participants.
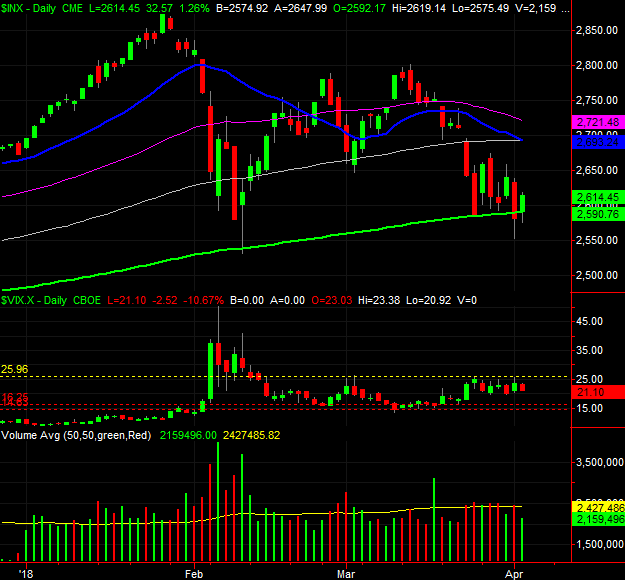
In retrospect, one can't help but wonder if Monday's encounter with (and support at) the S&P 500's 200-day moving average line is the only thing holding the sellers back. It might be enough, but it might not be enough either.
Take a look. Clearly there's something going on with the 200-day average line (green). One day doesn't make a trend though. Indeed, one day didn't even stop the bigger-picture pullback presently underway.
 [1]
[1]
Maybe it will. Maybe it's going to be a multi-day process. Or, maybe the lack of trading volume behind the effort speaks loudly and clearly about the lack of faith that a rebound is looming.
Makes sense. The sellers have been more persistent now than they've been in well over a year, and nobody can really argue that the gains seen since late 2016 have been unusually consistent. Now it's time to make up for lost time, injecting the profit-taking that should have unfurled several times in 2017.
And Tuesday's lack of volume is the big red flag… though the 20-day moving average line's move under the 100-day line isn't exactly something to dismiss.
Our take is the same as the one we posted on Monday. That is, there may be reason enough to expect a dead-cat bounce from here. There's just no assurance it'll go anywhere. The S&P 500 has room and reason to test the 20-day moving average line (blue) at 2693 before peeling back. It will take a move above that line to really get the market back in a bullish mood/mode. Just don't jump to conclusions if the buyers end up doing something with Tuesday's effort.
That said, the only thing that will decidedly tip the scales in a bearish direction (aside from the S&P 500's cross below its 200-day line) is the VIX's move above its ceiling at 26.0. There's little doubt that the VIX's underlying psychology is keeping a lid on it right now, which more or less says traders are ready and willing to bet on a pullback – and then make one happen – but they're not making it happen just yet.
The catch? As we also said on Monday, if a pullback is going to turn into an outright correction, the bears will have to pace themselves. The VIX can't surge and the S&P 500 can't plummet in a day, as it will invite the rapid buyback we've seen materialize so often of late.
Problem is, traders have done a pretty miserable job of pacing themselves of late.
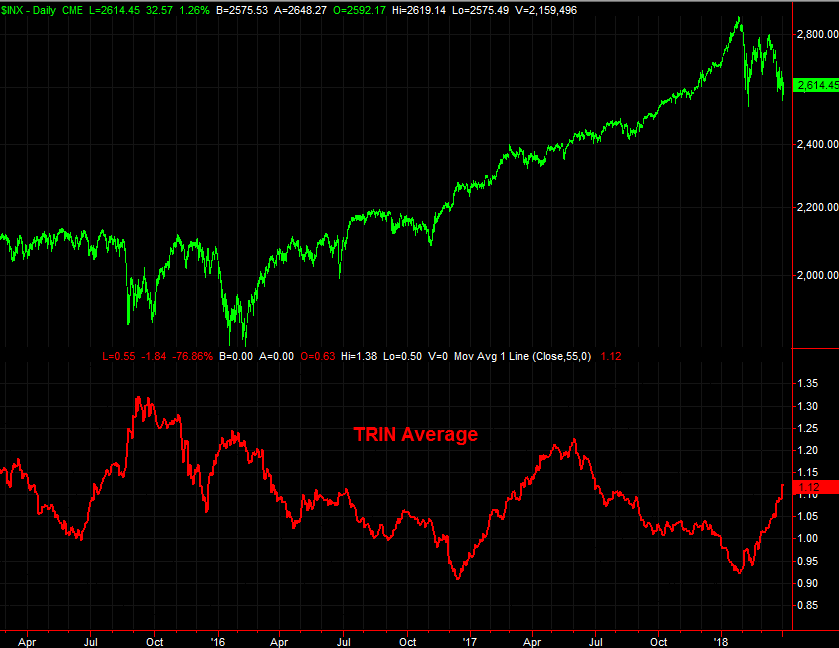
With all of that being said, we're still bearishly biased not because of something you see on the chart above, but because of something only evident on the chart below.
If you're a regular BigTrends reader you've seen this chart before. It's a moving average of the NYSE's Trading Index, or TRIN… though you'll sometimes see it referred to as the Arms Index, called so with respect to its developer, Richard Arms.
The short version of a long explanation of TRIN [2]: It compares the market's up volume and down volume to the market's total number of advancers and decliners for any given day. The raw data is too erratic to use, but by comparing it all and applying a trend line of the data (as we did below) you can ferret out the market's true undertow. A rising TRIN reading is bearish for the market, and a falling TRIN reading is bullish for the market. Take a look.
 [3]
[3]
It's not a perfect tool. It completely missed the early-2017 rally, signaling bearishness when it curled higher. Stocks were clearly still in rally mode. By and large though it's been a pretty good warning signal.
One of the drawbacks of the TRIN line is not being able to see exactly when the market is ready to pivot, though it's not completely awful in that regard. It usually turns in the other direction when the overall market does, telling is that there's no longer enough participation in a trend… the tank is empty, so to speak.
Either way, we do have a decent idea of how high is "too high" for the Arms Index. Once it reaches the 1.20 area using our line, we know a major bottom is nigh. Though we're close, we're not there yet this time around. The Arms Index is still rising, and that's working against the broad market even if it doesn't feel like a problem.
As is the case with all market indicators, some people will interpret them as foolproof, and will only consider it and no other. That's a mistake. This is only one of many clues to chew on, and again, it's not laser-precise in terms of timing.
Whatever's in the cards, odds are good that while a firm break below the S&P 500's 200-day moving average line will lead to a more meaningful corrective move, it will also set the stage for a major buying opportunity.
It won't feel like it at the time, as the S&P 500 could be around 2400 and still falling fast. The TRIN line should be peaking around then though, with the VIX also surging to amazing but unsustainably high levels. Those are all signs of a capitulation, and will be a buying opportunity for what's still a bull market.